Longitudinal evaluation of the effects of alendronate on MRI bone microarchitecture in postmenopausal osteopenic women
- PMID: 21059422
- PMCID: PMC4461063
- DOI: 10.1016/j.bone.2010.10.179
Longitudinal evaluation of the effects of alendronate on MRI bone microarchitecture in postmenopausal osteopenic women
Abstract
We evaluated longitudinal effects of alendronate on MRI-based trabecular bone structure parameters derived from dual thresholding and fuzzy clustering (BE-FCM) trabecular bone segmentation. Treatment effects were observed in the distal tibia after 24 months. The BE-FCM method increased correlations to HR-pQCT-based parameters.
Introduction: High-resolution magnetic resonance imaging (MRI) allows for non-invasive bone microarchitecture analysis. The goal of this study was to examine the potential of MRI-based trabecular bone structure parameters to monitor effects of alendronate in humans in vivo, and to compare the results to HR-pQCT and DXA measurements.
Materials and methods: Postmenopausal osteopenic women were divided into alendronate treatment and control groups, and imaged at baseline, 12 months, and 24 months (n = 52 at baseline) using 3T MRI, HR-pQCT, and DXA. Image acquisition sites included distal tibia (MRI and HR-pQCT), distal radius (MRI, DXA, and HR-pQCT), and the proximal femur (MRI and DXA). Two different regions of interest were evaluated. One contained the trabecular bone region within the entire MRI acquisition, and the second contained a subregion matched to the region contained in the HR-pQCT acquisition. The trabecular bone was segmented using two different methods; dual thresholding and BE-FCM. Trabecular bone structure parameters included bone volume fraction (BV/TV), number (Tb.N), spacing (Tb.Sp), and thickness (Tb.Th), along with seven geodesic topological analysis (GTA) parameters. Longitudinal changes and correlations to HR-pQCT and DXA measurements were evaluated.
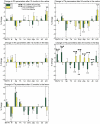
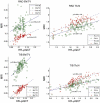
Results: Apparent Tb.N and four GTA parameters showed treatment effects (p < 0.05) in the distal tibia after 24 months in the entire MRI region using BE-FCM, as well as Tb.N using dual thresholding. No treatment effects after 24 months were observed in the HR-pQCT or in MRI analysis for the HR-pQCT-matched regions. Apparent BV/TV and Tb.N from BE-FCM had significantly higher correlations to HR-pQCT values compared to those derived from thresholding.
Conclusions: This study demonstrates the influence of computational methods and region of interest definitions on measurements of trabecular bone structure, and the feasibility of MRI-based quantification of longitudinal changes in bone microarchitecture due to bisphosphonate therapy. The results suggest that there may be a need to reevaluate the current standard HR-pQCT region definition for increased treatment sensitivity.
Published by Elsevier Inc.
Figures


Similar articles
-
A longitudinal HR-pQCT study of alendronate treatment in postmenopausal women with low bone density: Relations among density, cortical and trabecular microarchitecture, biomechanics, and bone turnover.J Bone Miner Res. 2010 Dec;25(12):2558-71. doi: 10.1002/jbmr.157. Epub 2010 Jun 18. J Bone Miner Res. 2010. PMID: 20564242 Free PMC article. Clinical Trial.
-
In vivo determination of bone structure in postmenopausal women: a comparison of HR-pQCT and high-field MR imaging.J Bone Miner Res. 2008 Apr;23(4):463-74. doi: 10.1359/jbmr.071116. J Bone Miner Res. 2008. PMID: 18052756
-
Effects of strontium ranelate and alendronate on bone microstructure in women with osteoporosis. Results of a 2-year study.Osteoporos Int. 2012 Jan;23(1):305-15. doi: 10.1007/s00198-011-1758-z. Epub 2011 Sep 10. Osteoporos Int. 2012. PMID: 21909729 Clinical Trial.
-
Clinical imaging of bone microarchitecture with HR-pQCT.Curr Osteoporos Rep. 2013 Jun;11(2):147-55. doi: 10.1007/s11914-013-0142-7. Curr Osteoporos Rep. 2013. PMID: 23504496 Free PMC article. Review.
-
The clinical application of high-resolution peripheral computed tomography (HR-pQCT) in adults: state of the art and future directions.Osteoporos Int. 2021 Aug;32(8):1465-1485. doi: 10.1007/s00198-021-05999-z. Epub 2021 May 22. Osteoporos Int. 2021. PMID: 34023944 Free PMC article. Review.
Cited by
-
Novel assessment tools for osteoporosis diagnosis and treatment.Curr Osteoporos Rep. 2014 Sep;12(3):357-65. doi: 10.1007/s11914-014-0215-2. Curr Osteoporos Rep. 2014. PMID: 24879507 Free PMC article. Review.
-
MRI assessment of bone structure and microarchitecture.J Magn Reson Imaging. 2017 Aug;46(2):323-337. doi: 10.1002/jmri.25647. Epub 2017 Feb 6. J Magn Reson Imaging. 2017. PMID: 28165650 Free PMC article. Review.
-
Performance of the MRI-based virtual bone biopsy in the distal radius: serial reproducibility and reliability of structural and mechanical parameters in women representative of osteoporosis study populations.Bone. 2011 Oct;49(4):895-903. doi: 10.1016/j.bone.2011.07.010. Epub 2011 Jul 19. Bone. 2011. PMID: 21784189 Free PMC article.
-
Bone microarchitecture in patients undergoing parathyroidectomy for management of secondary hyperparathyroidism.Bone Rep. 2020 Jul 15;13:100297. doi: 10.1016/j.bonr.2020.100297. eCollection 2020 Dec. Bone Rep. 2020. PMID: 32760761 Free PMC article.
-
Radiomorphological Manifestations of Femoral and Tibial Cortical Bones at Different Stages of Limb Lengthening.Indian J Orthop. 2019 Jul-Aug;53(4):567-573. doi: 10.4103/ortho.IJOrtho_443_18. Indian J Orthop. 2019. PMID: 31303674 Free PMC article.
References
-
- Kanis JA, Black D, Cooper C, Dargent P, Dawson-Hughes B, de Laet C, Delmas P, Eisman J, Johnell O, Jonsson B, Melton L, Oden A, Papapoulos S, Pols H, Rizzoli R, Silman A, Tenenhouse A. A new approach to the development of assessment guidelines for osteoporosis (on behalf of the Internatrional Osteoporosis Foundation and the National Osteoporosis Foundation, USA) Osteoporos Int. 2002;13:527–36. - PubMed
-
- Bone HG, Hosking D, Devogelaer J-P, Tucci JR, Emkey RD, Tonino RP, Rodriguez-Portales JA, Downs RW, Gupta J, Santora AC, Liberman UA. Ten years' experience with alendronate for osteoporosis in postmenopausal women. N Engl J Med. 2003;350(12):1189–99. - PubMed
-
- Liberman UA, Weiss SR, Broll J, Minne HW, Quan H, Bell NH, Rodriguez-Portales J, Downs R, Dequeker J, Favus M, Seeman E, Recker RR, Capizzi T, Santora AC, Lombardi A, Shah R, Hirsch LJ, Karpf DB. Effect of oral alendronate on bone mineral density and the incidence of fractures in postmenopausal osteoporosis. N Engl J Med. 1995;333(22):1437–43. - PubMed
-
- Orwoll E, Ettinger M, Weiss S, Miller P, Kendler D, Graham J, Adami S, Weber K, Lorenc R, Pietschmann P, Vandormael K, Lombardi A. Alendronate for the treatment of osteoporosis in men. N Engl J Med. 2000;343:604–10. - PubMed
-
- Black DM, an dD SRC, Karpf B, Cauley JA, Thompson DE, Nevitt MC, Bauer DC, Genant HK, Haskell WL, an RM, Ott SM, Torner JC, Quandt SA, Reiss TF, Ensrud KE. Randomised trial of effect of alendronate on risk of fracture in women with existing vertebral fractures. Lancet. 1996;348(9041):1535–41. - PubMed
Publication types
MeSH terms
Substances
Grants and funding
LinkOut - more resources
Full Text Sources
Medical

