. 2011 Jan 14;286(2):1429-35.
doi: 10.1074/jbc.M110.146530. Epub 2010 Nov 8.

MicroRNA-19 (miR-19) regulates tissue factor expression in breast cancer cells

Affiliations

MicroRNA-19 (miR-19) regulates tissue factor expression in breast cancer cells

Xiaoxi Zhang et al. J Biol Chem. .

Abstract

Tissue factor has been recognized as a regulator of tumor angiogenesis and metastasis. The tissue factor gene is selectively expressed in highly invasive breast cancer cells, and the mechanisms regulating tissue factor expression in these cells remain unclear. This study demonstrates that microRNA-19 (miR-19) regulates tissue factor expression in breast cancer cells, providing a molecular basis for the selective expression of the tissue factor gene. Tissue factor protein was barely detectable in MCF-7, T47D, and ZR-75-1 cells (less invasive breast lines) but was expressed at a significantly higher level in MDA-MB-231 and BT-20 cells (invasive breast lines) as assayed by Western blot. The tissue factor gene promoter was activated, and forced expression of tissue factor cDNA was achieved in MCF-7 cells, implying that the 3'-UTR of the tissue factor transcript is responsible for the suppression of tissue factor expression. Bioinformatics analysis predicted microRNA-binding sites for miR-19, miR-20, and miR-106b in the 3'-UTR of the tissue factor transcript. Reporter gene assay using the TF-3'-UTR luciferase reporter construct confirmed that the 3'-UTR negatively regulates gene expression in MCF-7 cells, an effect reversed by deletion of the miR-19-binding site. Application of the miR-19 inhibitor induces endogenous tissue factor expression in MCF-7 cells, and overexpression of miR-19 down-regulates tissue factor expression in MDA-MB-231 cells. RT-PCR analysis using cDNA made from Ago2-immunoprecipitated RNA samples confirmed that Ago2 binds preferentially to tissue factor 3'-UTR in MCF-7 cells, as compared with MDA-MB-231 cells, consistent with the observation that miR-19 levels are higher in MCF-7 cells.


Figures
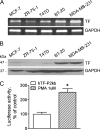
FIGURE 1.
FIGURE 1.
Tissue factor expression in breast cancer cells. A, total RNA was isolated from human breast cancer lines, reverse-transcribed, and PCR-amplified with specific primers covering tissue factor (TF) and GAPDH cDNA. The PCR products were separated on 1% agarose gel containing ethidium bromide. B, cellular lysates from MCF-7, MDA-MB-231, T47D, ZR-75-1, and BT-20 cells were subjected to Western blot using antibodies against human tissue factor and GAPDH (shown in A and B are representatives of three experiments). C, human tissue factor gene promoter activity (hTF-P2kb) is up-regulated by phorbol myristate acetate (PMA) in MCF-7 cells. Cells were transfected with the hTF-P2kb construct and treated with 1 μm phorbol myristate acetate for 4 h. Luciferase activity was analyzed as described under “Experimental Procedures.” Data (means ± S.E., n = 3) are expressed as percentages of the luciferase activity in untreated control cells. *, p < 0.05, compared with control cells, using one-way ANOVA analysis.
FIGURE 2.
FIGURE 2.
Forced expression of the tissue factor gene in MCF-7 and MDA-MB231 cells. A and B, cells were transfected with the YFP-TF chimera construct. 48 h after the transfection, the YFP expression was captured by a Leica TCS SP2 confocal microscope with LCS Lite imaging software (0.9 × 63 objective, excitation 517 nm and emission 527 nm). A phase contrast image of the cells was also captured and is shown on the right. Images are representative of three experiments. C, quantification of the YFP expression using the LCS Lite imaging software. D, YFP mRNA level was determined by reverse transcription-PCR, showing a similar expression level in MCF-7 and MDA-MB-231 cells.
FIGURE 3.
FIGURE 3.
3′-UTR of the tissue factor transcript suppresses luciferase activity in MCF-7 but not in MDA-MB-231 cells. A, diagram showing the tissue factor 3′-UTR cloned into PGL3 promoter vector in both sense (TF-3′-UTR-S) and antisense orientation (TF-3′-UTR-A). B, MCF-7 and MDA-MB-231 cells were transfected with the TF-3′-UTR-S or TF-3′-UTR-A constructs. Luciferase (Luc) activity was analyzed 48 h after transfection. Data (means ± S.E., n = 3) are expressed as percentages of the luciferase activity detected in TF-3′-UTR-A transfected cells. C, shown are miR-19- and miR-106b-binding sites in the tissue factor 3′-UTR. The underlined nucleotides were deleted in the TF-3′-UTR-S reporter construct. D, MCF-7 (left panel) and MDA-MB-231 (right panel) cells were transfected with the TF-3′-UTR-A, TF-3′-UTR-S, or the two deletion constructs (del-1, miR-19-binding site deletion; del-2, miR-106b-binding site deletion), respectively. Luciferase activity was analyzed 48 h after transfection. Data (means ± S.E., n = 3) are expressed as percentages of the luciferase activity detected in TF-3′-UTR-A transfected cells. *, p < 0.05, compared with the 3′-UTR-A transfected cells, using one-way ANOVA followed by Dunnett analysis.
FIGURE 4.
FIGURE 4.
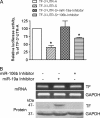
miR-19 inhibitor enhances tissue factor expression in MCF-7 cells. MicroRNA inhibitors (100 nm, final concentration) were co-transfected with the TF-3′-UTR-S construct into MCF-7 cells. Three days after the transfection, luciferase activity (A), tissue factor (TF) mRNA and protein levels (B) were analyzed. Shown in B are representative images of three experiments. Data for A (means ± S.E., n = 3) are expressed as percentages of the luciferase activity detected in TF-3′-UTR-A transfected cells. *, p < 0.05, compared with the 3′-UTR-A transfected cells, using one-way ANOVA followed by Dunnett analysis.
FIGURE 5.
FIGURE 5.
miR-19 mimics suppress tissue factor expression in MDA-MB-231 cells. miR-19a mimics (100 nm, final concentration) were co-transfected with the TF-3′-UTR-S construct into MDA-MB-231 cells. Three days after the transfection, miR-19a levels (A), luciferase activity (B), and tissue factor (TF) mRNA and protein levels (C) were analyzed. Densitometry analysis of the Western blot results was included (D, tissue factor expression levels normalized by GAPDH). Data for A (means ± S.E., n = 3) are expressed as fold of control. Data for B (means ± S.E., n = 3) are expressed as percentages of the luciferase activity detected in TF-3′-UTR-S transfected cells. *, p < 0.05, compared with TF-3′-UTR-S transfected cells, using one-way ANOVA followed by Dunnett analysis. Shown in C are representative images of three experiments.
FIGURE 6.
FIGURE 6.
Ago2 protein favorably binds to the tissue factor 3′-UTR in MCF-7 cells. A, expression levels of miR-19 in MCF-7 and MDA-MB-231 cells, as determined by real time PCR (n = 3). B, top panel, tissue factor (TF) and GAPDH mRNA expression in MCF-7 and MDA-MB-231 cells, as analyzed by reverse transcription PCR. Middle panel, cell lysate from MCF-7 and MDA-MB-231 cells were immunoprecipitated with the Ago2 antibody, and RNA was isolated from the precipitants, reverse-transcribed, and PCR-amplified using primers covering the tissue factor 3′-UTR and GAPDH mRNA. The PCR products were separated in 1% agarose gel containing ethidium bromide and visualized under UV light. Shown are representative gels of three experiments. Low panel, Western blot analysis of Ago2 protein expression in MCF-7 and MDA-MB-231 cells (representative images of two experiments).

References

    1. Tsopanoglou N. E., Maragoudakis M. E. (2007) Semin. Thromb. Hemost. 33, 680–687 - PubMed
    1. Bluff J. E., Brown N. J., Reed M. W., Staton C. A. (2008) Breast Cancer Res. 10, 204. - PMC - PubMed
    1. Camerer E., Huang W., Coughlin S. R. (2000) Proc. Natl. Acad. Sci. U.S.A. 97, 5255–5260 - PMC - PubMed
    1. Schaffner F., Ruf W. (2009) Arterioscler. Thromb. Vasc. Biol. 29, 1999–2004 - PMC - PubMed
    1. Camerer E., Rottingen J. A., Gjernes E., Larsen K., Skartlien A. H., Iversen J. G., Prydz H. (1999) J. Biol. Chem. 274, 32225–32233 - PubMed

Publication types

MeSH terms