. 2011 Jan;39(2):e9.
doi: 10.1093/nar/gkq1015. Epub 2010 Nov 8.

Accurate quantification of transcriptome from RNA-Seq data by effective length normalization

Affiliations

Accurate quantification of transcriptome from RNA-Seq data by effective length normalization

Soohyun Lee et al. Nucleic Acids Res. 2011 Jan.

Abstract

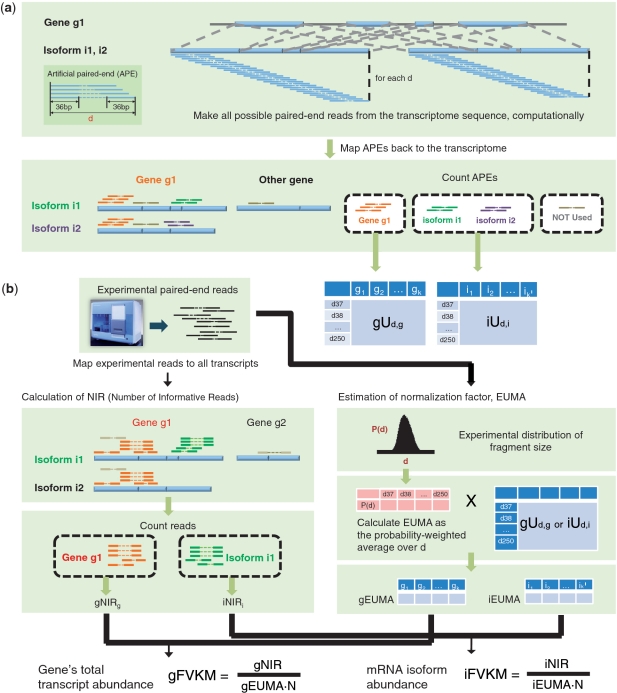
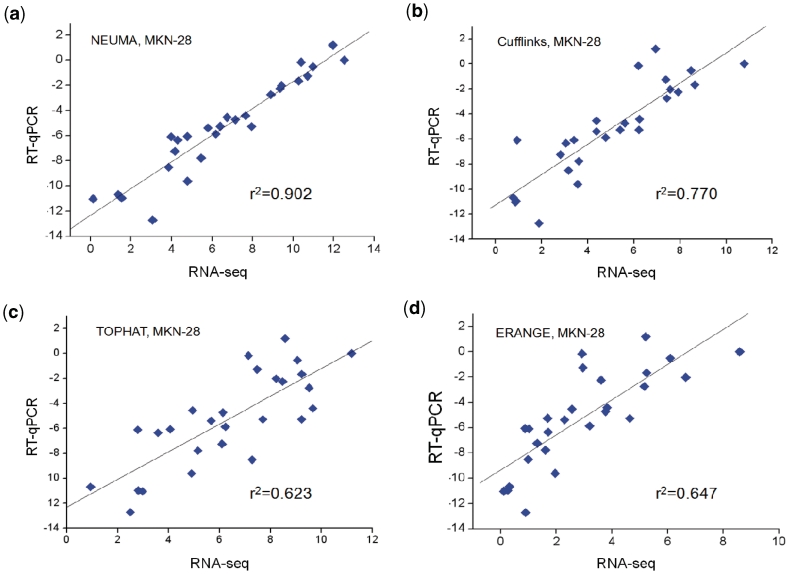
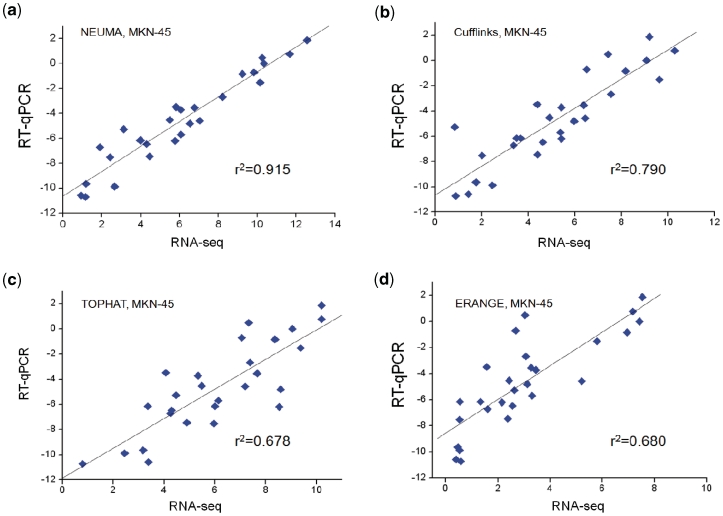
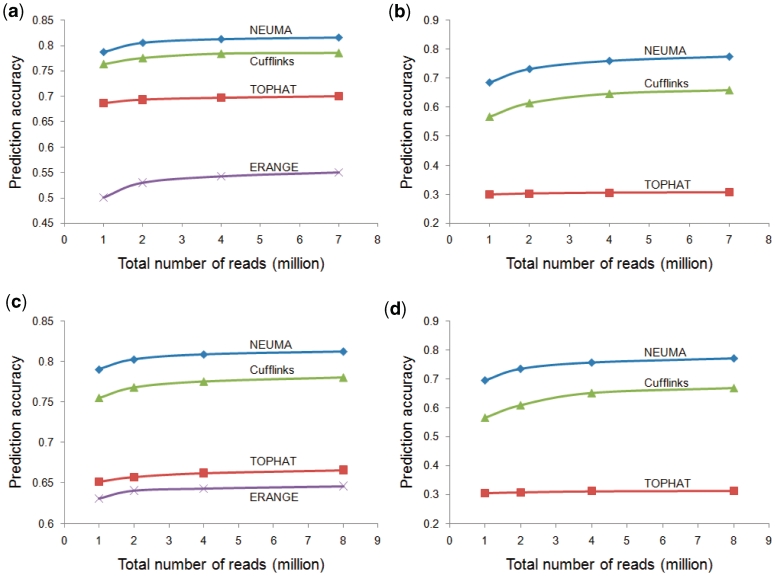
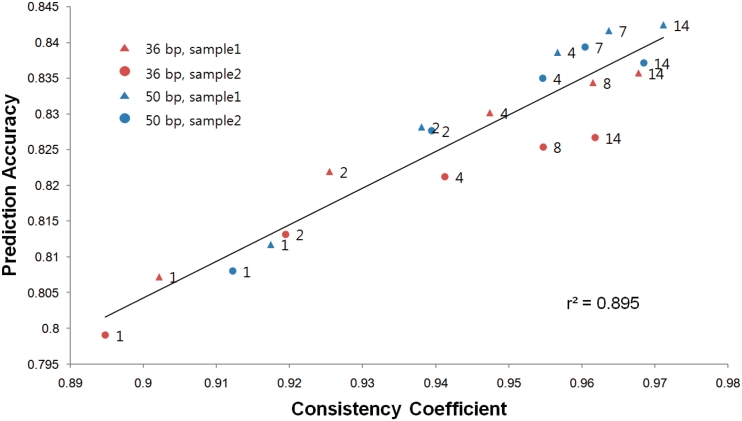
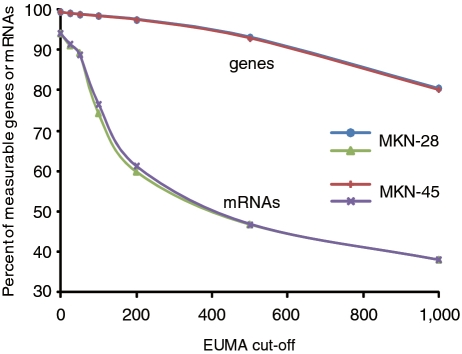
We propose a novel, efficient and intuitive approach of estimating mRNA abundances from the whole transcriptome shotgun sequencing (RNA-Seq) data. Our method, NEUMA (Normalization by Expected Uniquely Mappable Area), is based on effective length normalization using uniquely mappable areas of gene and mRNA isoform models. Using the known transcriptome sequence model such as RefSeq, NEUMA pre-computes the numbers of all possible gene-wise and isoform-wise informative reads: the former being sequences mapped to all mRNA isoforms of a single gene exclusively and the latter uniquely mapped to a single mRNA isoform. The results are used to estimate the effective length of genes and transcripts, taking experimental distributions of fragment size into consideration. Quantitative RT-PCR based on 27 randomly selected genes in two human cell lines and computer simulation experiments demonstrated superior accuracy of NEUMA over other recently developed methods. NEUMA covers a large proportion of genes and mRNA isoforms and offers a measure of consistency ('consistency coefficient') for each gene between an independently measured gene-wise level and the sum of the isoform levels. NEUMA is applicable to both paired-end and single-end RNA-Seq data. We propose that NEUMA could make a standard method in quantifying gene transcript levels from RNA-Seq data.


Figures

Figure 1.
Figure 1.
Algorithm overview, for paired-end RNA-Seq. (a) Calculation of gU and iU tables. First, all possible APEs are computationally made from the transcriptome sequence. The length d of an APE is fixed at each round. APEs are mapped back to the transcriptome sequence and classified into groups representing gene-wise (orange) and isoform-wise (green and violet) informative reads. APEs mapped on multiple genes (grey) are not used. For each mRNA isoform, APEs specific to the isoform are counted (iUd,i). For each gene, gene-wise informative APEs are counted (gUd,g). This procedure (from extraction of APEs to calculation of iUd,i and gUd,g) is repeated for every d, ranging from 37 to 250 bp in case of the 36-bp data. As a result, we obtain matrices gUd,g and iUd,i. (b) Calculation of EUMA and expression levels. Real RNA-Seq reads are mapped to the transcriptome sequence. For each gene gEUMA is computed by averaging gUd,i over all d, with weight P(d). iEUMA is computed likewise. P(d) is the probability distribution obtained from all mapped reads from the experiment. Then, for each gene, reads that are mapped to all of the gene's mRNA isoforms and not mapped to any other mRNA isoforms are counted (gNIR). Likewise, for each mRNA isoform, reads that are specifically mapped to the mRNA isoform are counted (iNIR). Finally, gNIR and iNIR are divided by gEUMA and iEUMA, to produce the mRNA abundance at the gene and isoform levels, respectively.
Figure 2.
Figure 2.
Scatter plots of gene’s total transcript level measured by RT–qPCR (log2-transformed) versus estimation from RNA-Seq [log2(x + 1)-transformed RPKM, FPKM and FVKM] for human gastric cancer cell line MKN-28. Four different RNA-Seq processing methods were compared: (a) NEUMA (FVKM), (b) Cufflinks (FPKM), (c) TOPHAT (RPKM) and (d) ERANGE (RPKM).
Figure 3.
Figure 3.
Scatter plots of gene’s total transcript level measured by RT–qPCR (log2-transformed) versus estimation from RNA-Seq [log2(x + 1)-transformed RPKM, FPKM and FVKM] for human gastric cancer cell line MKN-45. Four different RNA-Seq processing methods were compared: (a) NEUMA (FVKM), (b) Cufflinks (FPKM), (c) TOPHAT (RPKM) and (d) ERANGE (RPKM).
Figure 4.
Figure 4.
Comparison of four methods in prediction accuracy as a function of total number of reads. Prediction accuracy was defined as the Pearson correlation coefficient between true and estimated mRNA abundances. The x-axis denotes the total number of reads generated in each simulation for technical replicates. (a) Gene-level estimation for 50-bp paired-end RNA-Seq data. (b) Isoform-level estimation for 50-bp paired-end RNA-Seq data. (c and d) Gene and isoform-level estimation for 36-bp single-end RNA-Seq data. ERANGE does not report mRNA isoform abundances and was excluded from isoform analyses.
Figure 5.
Figure 5.
Plot of prediction accuracy versus consistency coefficient for technical replicates of four simulated 36- and 50-bp paired-end RNA-Seq samples. Each data point represents different number of sequence reads generated (labeled in million).
Figure 6.
Figure 6.
The percent of measurable genes and isoforms as a function of EUMA cutoff in two MKN cell lines.
Figure 7.
Figure 7.
Isoform structure of RPS24 gene. All six mRNA isoforms have unique regions.

References

    1. Sultan M, Schulz MH, Richard H, Magen A, Klingenhoff A, Scherf M, Seifert M, Borodina T, Soldatov A, Parkhomchuk D, et al. A global view of gene activity and alternative splicing by deep sequencing of the human transcriptome. Science. 2008;321:956–960. - PubMed
    1. Nagalakshmi U, Wang Z, Waern K, Shou C, Raha D, Gerstein M, Snyder M. The transcriptional landscape of the yeast genome defined by RNA sequencing. Science. 2008;320:1344–1349. - PMC - PubMed
    1. Mortazavi A, Williams BA, McCue K, Schaeffer L, Wold B. Mapping and quantifying mammalian transcriptomes by RNA-Seq. Nat. Methods. 2008;5:621–628. - PubMed
    1. Ramskold D, Wang ET, Burge CB, Sandberg R. An abundance of ubiquitously expressed genes revealed by tissue transcriptome sequence data. PLoS Comput. Biol. 2009;5:e1000598. - PMC - PubMed
    1. Wang ET, Sandberg R, Luo S, Khrebtukova I, Zhang L, Mayr C, Kingsmore SF, Schroth GP, Burge CB. Alternative isoform regulation in human tissue transcriptomes. Nature. 2008;456:470–476. - PMC - PubMed

Publication types