

Testosterone threshold levels and lean tissue mass targets needed to enhance skeletal muscle strength and function: the HORMA trial
- PMID: 21059836
- PMCID: PMC3032430
- DOI: 10.1093/gerona/glq183
Testosterone threshold levels and lean tissue mass targets needed to enhance skeletal muscle strength and function: the HORMA trial
Abstract
Background: In the HORMA (Hormonal Regulators of Muscle and Metabolism in Aging) Trial, supplemental testosterone and recombinant human growth hormone (rhGH) enhanced lean body mass, appendicular skeletal muscle mass, muscle performance, and physical function, but there was substantial interindividual variability in outcomes.
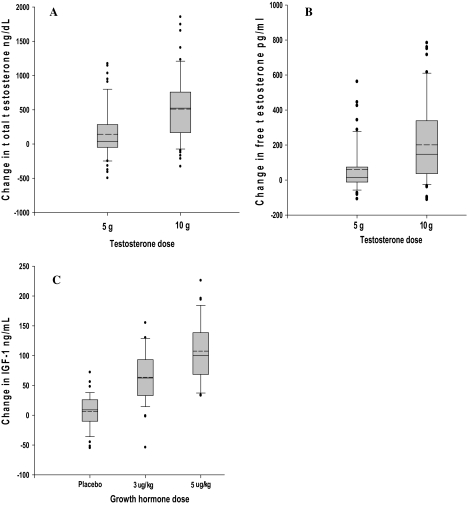
Methods: One hundred and twelve men aged 65-90 years received testosterone gel (5 g/d vs 10 g/d via Leydig cell clamp) and rhGH (0 vs 3 vs 5 μg/kg/d) in a double-masked 2 × 3 factorial design for 16 weeks. Outcomes included lean tissue mass by dual energy x-ray absorptiometry, one-repetition maximum strength, Margaria stair power, and activity questionnaires. We used pathway analysis to determine the relationship between changes in hormone levels, muscle mass, strength, and function.
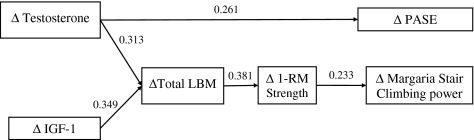
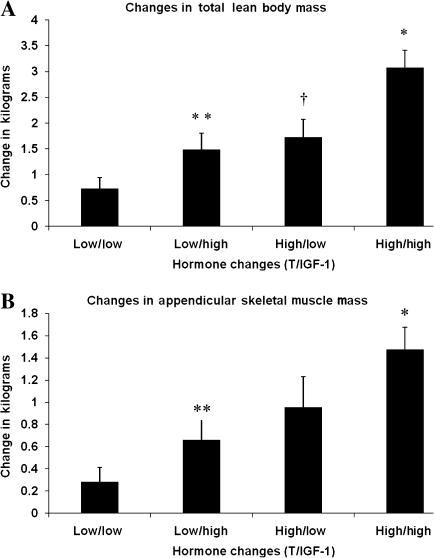
Results: Increases in total testosterone of 1046 ng/dL (95% confidence interval = 1040-1051) and 898 ng/dL (95% confidence interval = 892-904) were necessary to achieve median increases in lean body mass of 1.5 kg and appendicular skeletal muscle mass of 0.8 kg, respectively, which were required to significantly enhance one-repetition maximum strength (≥ 30%). Co-treatment with rhGH lowered the testosterone levels (quantified using liquid chromatography-tandem mass spectrometry) necessary to reach these lean mass thresholds. Changes in one-repetition maximum strength were associated with increases in stair climbing power (r = .26, p = .01). Pathway analysis supported the model that changes in testosterone and insulin-like growth factor 1 levels are related to changes in lean body mass needed to enhance muscle performance and physical function. Testosterone's effects on physical activity were mediated through a different pathway because testosterone directly affected Physical Activity Score of the Elderly.
Conclusions: To enhance muscle strength and physical function, threshold improvements in lean body mass and appendicular skeletal muscle mass are necessary and these can be achieved by targeting changes in testosterone levels. rhGH augments the effects of testosterone. To maximize functional improvements, the doses of anabolic hormones should be titrated to achieve target blood levels.
Figures
References
-
- Lindle RS, Metter EJ, Lynch NA, et al. Age and gender comparisons of muscle strength in 654 women and men aged 20-93 yr. J Appl Physiol. 1997;83(5):1581–1587. - PubMed
-
- Bassey EJ, Bendall MJ, Pearson M. Muscle strength in the triceps surae and objectively measured customary walking activity in men and women over 65 years of age. Clin Sci. 1988;74(1):85–89. - PubMed
-
- Abbasi AA, Drinka PJ, Mattson DE, Rudman D. Low circulating levels of insulin-like growth factors and testosterone in chronically institutionalized elderly men. J Am Geriatr Soc. 1993;41(9):975–982. - PubMed
-
- Harman SM, Metter EJ, Tobin JD, Pearson J, Blackman MR. Longitudinal effects of aging on serum total and free testosterone levels in healthy men. Baltimore Longitudinal Study of Aging. J Clin Endocrinol Metab. 2001;86(2):724–731. - PubMed
-
- Baumgartner RN, Waters DL, Gallagher D, Morley JE, Garry PJ. Predictors of skeletal muscle mass in elderly men and women. Mech Ageing Dev. 1999;107(2):123–136. - PubMed
Publication types
MeSH terms
Substances
Grants and funding
LinkOut - more resources
Full Text Sources
Other Literature Sources
