. 2010 Nov 15;191(4):875-90.
doi: 10.1083/jcb.201004154. Epub 2010 Nov 8.

The centrosome neither persistently leads migration nor determines the site of axonogenesis in migrating neurons in vivo

Affiliations

The centrosome neither persistently leads migration nor determines the site of axonogenesis in migrating neurons in vivo

Martin Distel et al. J Cell Biol. .

Erratum in

  • J Cell Biol. 2010 Dec 27;191(7):1413

Abstract

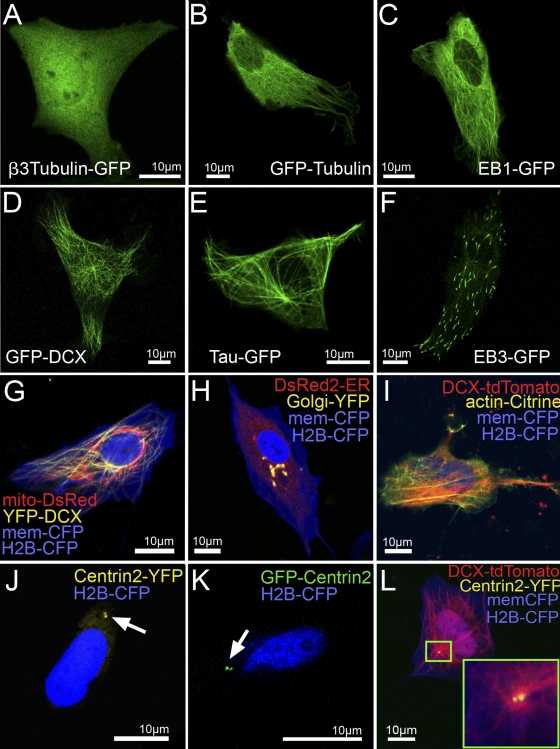
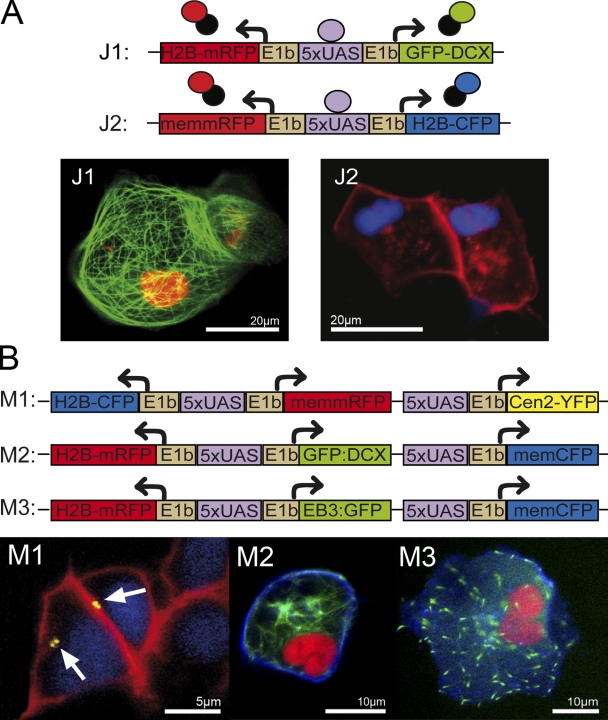
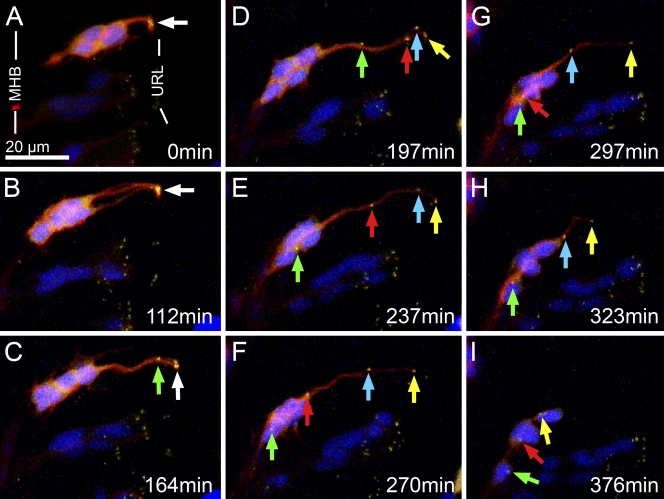
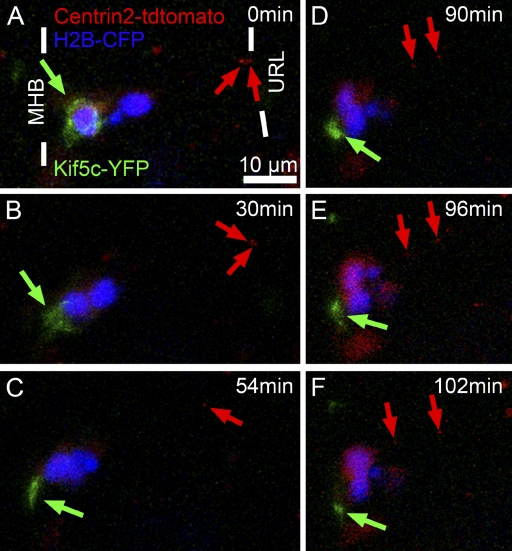
The position of the centrosome ahead of the nucleus has been considered crucial for coordinating neuronal migration in most developmental situations. The proximity of the centrosome has also been correlated with the site of axonogenesis in certain differentiating neurons. Despite these positive correlations, accumulating experimental findings appear to negate a universal role of the centrosome in determining where an axon forms, or in leading the migration of neurons. To further examine this controversy in an in vivo setting, we have generated cell type-specific multi-cistronic gene expression to monitor subcellular dynamics in the developing zebrafish cerebellum. We show that migration of rhombic lip-derived neurons is characterized by a centrosome that does not persistently lead the nucleus, but which is instead regularly overtaken by the nucleus. In addition, axonogenesis is initiated during the onset of neuronal migration and occurs independently of centrosome proximity. These in vivo data reveal a new temporal orchestration of organelle dynamics and provide important insights into the variation in intracellular processes during vertebrate brain differentiation.


Figures

Figure 1.
Figure 1.
Identification of subcellular markers for in vivo imaging of zebrafish cells. Images of zebrafish Pac2 fibroblasts transfected with pCS2+ constructs encoding fluorescently tagged markers for subcellular labeling 24 h after transfection. (A) β3-tubulin-GFP, (B) GFP-tubulin, (C) EB1-GFP, (D) GFP-DCX, (E) Tau-GFP, and (F) EB3-GFP. (G) mito-DsRed to label mitochondria in red, YFP-DCX to label microtubules in yellow, memCFP to label the cytoplasmic membrane in blue and H2B-CFP to label the nucleus in blue; (H) DsRed2-ER to label the ER in red, Golgi-YFP to label the Golgi apparatus in yellow, memCFP and H2B-CFP; (I) DCX-tdTomato to label microtubules in red, actin-Citrine to label the actin cytoskeleton in yellow, memCFP, H2B-CFP; (J) Centrin2-YFP to label the centrosome in yellow (arrow is indicating the two centrioles of the centrosome) and H2B-CFP; (K) GFP-Centrin2 to label the centrosome in green (arrow is indicating the two centrioles of the centrosome); and (L) DCX-tdTomato, Centrin2-YFP, memCFP, and H2B-CFP. The inset shows a higher magnification of the centrosome at the hub of the microtubule network. These data present a collection of subcellular-targeted fluorescent proteins tested for their specificity in zebrafish cells. “mem“ represents a membrane localization signal, which consists of a plamitylation and myristinylation sequence of the human Lck kinase.
Figure 2.
Figure 2.
Janus and Medusa Gal4 effector constructs for simultaneous expression of multiple subcellular labels. (A) Schematic representation of bidirectional Janus vectors J1 and J2. Upon binding of Gal4, two subcellular markers are expressed simultaneously (J1: H2B-mRFP labels the nucleus in red and GFP-DCX the microtubules in green; J2: memmRFP labels the membrane in red and H2B-CFP the nucleus in blue). (B) Schematic representation of Medusa vectors M1, M2, and M3. From each vector, the expression of three subcellular markers is activated in the presence of Gal4. M1 encodes H2B-CFP to label the nucleus in blue, memmRFP to mark the membrane in red, and Centrin2-YFP to label the centrioles of the centrosome in yellow. M2: H2B-mRFP to label the nucleus in red, GFP-DCX to label microtubules in green, and memCFP to label the membrane in blue. M3 codes for the same nuclear and membrane markers as M2, but contains EB3-GFP to label the plus-ends of microtubules. These data demonstrate that reliable coexpression of various transgenes can be achieved from Gal4-mediated multicistronic expression vectors. Images were obtained from living zebrafish embryos (24 hpf) coinjected at the one-cell stage with the respective Janus or Medusa vectors and a vector coding for Gal4. “mem“ represents a membrane localization signal, which consists of a plamitylation and myristinylation sequence of the human Lck kinase. Arrows in M1 indicate YFP-labeled centrosomes.
Figure 3.
Figure 3.
Characterization of Tg(atoh1a:Gal4TA4)hzm2 transgenic zebrafish. Lateral view of an offspring of Tg(atoh1a:Gal4TA4)hzm2 x Tg(4xUAS:GFP)hzm3 transgenic fish at 24 hpf. (A) Endogenous atonal1a expression in the rhombic lip as revealed by in situ hybridization (black). (B) Immunostaining for GFP after in situ hybridization for atonal1a on Tg(atoh1a:Gal4TA4)hzm2/Tg(4xUAS:GFP)hzm3 double-transgenic fish shows expression of GFP (green) in the rhombic lip in atonal1a-expressing cells (black). (C) In addition, some GFP-expressing cells can be found in the retina, the midbrain tegmentum, and the tectum of Tg(atoh1a:Gal4TA4)hzm2/Tg(4xUAS:GFP)hzm3 double-transgenic fish. (D) Enlargement of boxed area in A showing in situ hybridization for atonal1a in the hindbrain. (E) Immunostaining for GFP. (F) Overlay of D and E. These data show that KalTA4 expression in Tg(atoh1a:Gal4TA4)hzm2 embryos faithfully recapitulates rhombic lip expression of endogenous atonal1a. MHB, midbrain–hindbrain boundary; URL, upper rhombic lip.
Figure 4.
Figure 4.
Time-lapse analysis of THN progenitor behavior. (A) Lateral view of the MHB region of a Tg(atoh1a:Gal4TA4)hzm2 x Tg(shhb:Gal4TA4,5xUAS:mRFP)hzm4 embryo at 24 hpf. URL-derived THN progenitors are labeled by mRFP expression. The boxed area is enlarged in B–F. (B) mRFP-expressing THN progenitors are connected to the apical surface by thin processes (arrow). (C) THN progenitors divide at the apical side (arrows indicate dividing cell). (D) During radial migration these cells maintain apical processes (arrows) that are retracted (E) once the nuclei reach the MHB. (F) Around the same time, axon-like processes become visible (arrow). These time-lapse data show that transgene expression mediated by Gal4 in Tg(atoh1a:Gal4TA4)hzm2 embryos reveals cell behavior consistent with that previously observed for URL-derived THN neurons (Köster and Fraser, 2001a; Volkmann et al., 2010). Images were taken from Video 4. MHB, midbrain–hindbrain boundary; URL, upper rhombic lip.
Figure 5.
Figure 5.
In vivo subcellular imaging of INM and mitotic cleavages of THN progenitors. Lateral view of THN progenitors in the cerebellum of an ∼24-hpf Tg(atoh1a:Gal4TA4)hzm2 transgenic embryo injected with Medusa vector M1. Centrosomes are shown in yellow, cell nuclei in blue, and cellular membranes in red. (A) Centrosomes (arrows) were found to line the fourth ventricle at the apical side of the four THN progenitors undergoing INM between the midbrain–hindbrain boundary (MHB) and the fourth ventricle. Throughout INM, the centrosomes did not change their positions. Green asterisk demarcates a nucleus moving from apical to basal (A and B), while the corresponding centrosome (green arrow) stays at the apical side. The orange asterisk demarcates a nucleus that moves from basal to apical (A–C) to undergo a mitotic cleavage at the apical side (C). The corresponding centrosome (orange arrow) stays at the apical side, replicating to build the two spindle poles of the spindle apparatus (C, orange arrows). Thus, THN progenitors along the URL show characteristic INM behavior. Images are taken from Video 5. Note: some yellow-only labeling may suggest insufficient coexpression of transgenes from Medusa vectors. However, dependent on the z-level position of organelles and different intensities in expression levels, proper co-labeling can only be observed in cells of interest for which z-stacks were recorded. MHB, midbrain–hindbrain boundary; URL, upper rhombic lip.
Figure 6.
Figure 6.
In vivo subcellular imaging of centrosome dynamics in THN progenitors. Lateral view of the cerebellar anlage of an ∼36-hpf Tg(atoh1a:Gal4TA4)hzm2 transgenic embryo injected with Medusa vector M1. Centrosomes (green arrow indicates the first centrosome, red arrow second, turquoise third, and yellow fourth; white arrows are shown when centrosomes are indistinguishable) are labeled in yellow, cell nuclei in blue, and cellular membranes in red. (A) Centrosomes (arrow) of the four THN progenitors were found to line the fourth ventricle. (B) Nuclei translocate basally toward the MHB, leaving behind a long trailing process containing the centrosome at its most apical part. This subcellular coordination argues that the final MHB-directed cell movement to initiate migration represents an extended final step of INM. (C–I) When nuclei reach the MHB, trailing processes containing the centrosomes at the most apical position are retracted, representing the initiation of THN neuron migration. Images are taken from Video 6. MHB, midbrain–hindbrain boundary; URL, upper rhombic lip.
Figure 7.
Figure 7.
Subcellular imaging of saltatory nuclear movements in migrating THN progenitors. Lateral views of a region of the cerebellum of a 36-hpf Tg(atoh1a:Gal4TA4)hzm2 transgenic zebrafish embryo injected with Medusa vector M1. (A–C) According to the direction of migration, the centrosome (arrow) translocates in front of the nucleus (asterisk). (C and D) The nucleus then overtakes the centrosome in a rapid saltatory movement such that the centrosome locates posterior to the nucleus (D). Subesequently, the centrosome translocates once again ahead of the nucleus (E). In a second saltatory movement, the nucleus again overtakes the centrosome (F). These time-lapse data show that during saltatory nucleokinetic migration, THN neurons display iterative cycles of a centrosome leading and trailing the nucleus. Images are maximum projections of z-stacks. The time between images taken from Video 8 is indicated in the bottom right of each panel. MHB, midbrain–hindbrain boundary; URL, upper rhombic lip.
Figure 8.
Figure 8.
Analysis of THN migratory movements. (A) Kymograph of a portion of Video 6 (229–390 min) showing the gradual movement of cell nuclei toward the MHB. Images have been rotated 45° and only the blue channel is shown in order to better visualize the nuclei. Each nucleus is labeled with a colored dot. Time between frames is 404.2 s. (B) Kymograph created from Video 8, showing two saltatory movements of the nucleus (asterisks) and the comparatively smooth forward migration of the centrosome during ventral migration. Images were rotated 45° and the time between frames is 522.6 s. The centrosome is ahead of the nucleus immediately before a nucleokinetic movement, but is overtaken when the nucleus jumps forward. (C) Graph of the cumulative migration distance (in any direction) for each nucleus in Video 6. Colors match the dots used for labeling nuclei in A. Tracking was done on 2D maximum projections with the Manual Tracking tool of ImageJ. The nuclei move at a gradual pace until they reach the MHB, at which point one nucleus undergoes a saltatory movement (red bar). The blue bar represents the region of the video shown in the kymograph in A. (D) Graph of the cumulative migration distance (in all directions) of the centrosome and nucleus in Video 8. During ventral migration, the cells undergo obvious nucleokinetic movements (red bars). The centrosome moves at a more consistent and gradual pace. (E) Pie chart showing the amount of time that the centrosome spends ahead of, lateral to, or behind the centroid of the nucleus (n = 4 cells, 3 embryos). (F) 3D graph showing the portion of time during which the centrosome and nucleus in Video 8 are each stationary, move in the direction of migration (forward), or move opposite to the direction of migration (backward). The movement of both organelles is predominantly in the direction of migration, but much of the forward centrosomal movement occurs while the nucleus is stationary.
Figure 9.
Figure 9.
THN progenitors initiate axonogenesis from their leading process independent of centrosome proximity. (A) Lateral view of the cerebellar anlage of an ∼42-hpf Tg(atoh1a:Gal4TA4)hzm2 transgenic zebrafish embryo injected with Medusa vector M1. An axon-like protrusion (white asterisk) has formed at the time when the centrosome (white arrow) is still homing toward the soma. (B) Lateral view of a Tg(atoh1a:Gal4TA4)hzm2 x Tg(4xUAS:GFP)hzm3 transgenic zebrafish embryo at 42 hpf. GFP-expressing cells are visualized by anti-GFP immunostaining (green) and acetylated microtubules by anti-acetylated tubulin immunostaining (red). (C) Enlargement of boxed area in B. Arrows indicate acetylated microtubules present in GFP-expressing THN progenitors, indicating the presence of axons by 42 hpf. (D–F) Lateral view of the cerebellum of a 40-hpf Tg(atoh1a:Gal4TA4)hzm2 transgenic zebrafish embryo injected with Medusa vector M1. (D) A THN progenitor (white asterisk) extends a process, the presumptive axon with a growth cone–like structure (red arrow), while the centrosome (white arrow) starts to translocate toward the soma. (E and F) The axon-like process elongates while the centrosome is moving toward the soma and is still far removed from the site of axonogenesis. These findings suggest that the site of axon formation in THN neurons is independent of a proximally positioned centrosome. Images in D–F are taken from Video 9. MHB, midbrain–hindbrain boundary; URL, upper rhombic lip.
Figure 10.
Figure 10.
In vivo imaging of axonogenesis. Lateral view of the cerebellar anlage of a 36-hpf Tg(atoh1a:Gal4TA4)hzm2 transgenic zebrafish embryo coinjected with Janus vector J8 (marking nucleus in blue and centrosome in red, red arrows) and 5xUAS:Kif5c-YFP (emerging axons labeled with yellow fluorescence, here shown in green). (A) Due to coinjection of two vectors, only the more anteriorly located cell expresses the Kif5c-YFP fusion protein. Kif5c-YFP is initially distributed throughout the soma of the cell (green arrow), while the centrosomes of both cells are localized at the apical side (red arrows). (B–D) Kif5c-YFP localizes to a protrusion, the later axon, in the front of the cell, at the time when the centrosome is homing toward the soma. (E and F) Kif5c-YFP localizes to a growth cone–like structure of the emerging axon, while the centrosome has not reached the soma. This temporal sequence of axonogenesis and centrosome dynamics reveals that a proximal position of the centrosome is not required for selecting the site of axon formation in THN neurons in vivo. Images are taken from Video 10. MHB, midbrain-hindbrain boundary; URL, upper rhombic lip.

References

    1. Arimura N., Kaibuchi K. 2007. Neuronal polarity: from extracellular signals to intracellular mechanisms. Nat. Rev. Neurosci. 8:194–205 10.1038/nrn2056 - DOI - PubMed
    1. Asakawa K., Suster M.L., Mizusawa K., Nagayoshi S., Kotani T., Urasaki A., Kishimoto Y., Hibi M., Kawakami K. 2008. Genetic dissection of neural circuits by Tol2 transposon-mediated Gal4 gene and enhancer trapping in zebrafish. Proc. Natl. Acad. Sci. USA. 105:1255–1260 10.1073/pnas.0704963105 - DOI - PMC - PubMed
    1. Babaryka A., Kühn E., Köster R.W. 2009. In vivo synthesis of meganuclease for generating transgenic zebrafish Danio rerio. J. Fish Biol. 74:452–457 10.1111/j.1095-8649.2008.02075.x - DOI - PubMed
    1. Basto R., Lau J., Vinogradova T., Gardiol A., Woods C.G., Khodjakov A., Raff J.W. 2006. Flies without centrioles. Cell. 125:1375–1386 10.1016/j.cell.2006.05.025 - DOI - PubMed
    1. Bellion A., Baudoin J.P., Alvarez C., Bornens M., Métin C. 2005. Nucleokinesis in tangentially migrating neurons comprises two alternating phases: forward migration of the Golgi/centrosome associated with centrosome splitting and myosin contraction at the rear. J. Neurosci. 25:5691–5699 10.1523/JNEUROSCI.1030-05.2005 - DOI - PMC - PubMed

Publication types

MeSH terms