. 2010 Nov 22;207(12):2581-94.
doi: 10.1084/jem.20091071. Epub 2010 Nov 8.

Gain of MYC underlies recurrent trisomy of the MYC chromosome in acute promyelocytic leukemia

Affiliations

Gain of MYC underlies recurrent trisomy of the MYC chromosome in acute promyelocytic leukemia

Letetia Jones et al. J Exp Med. .

Abstract

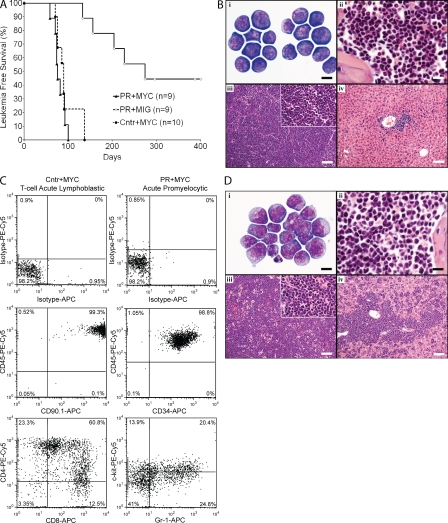
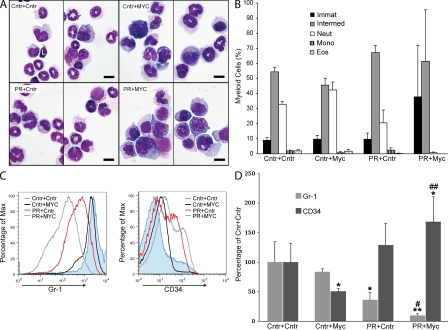
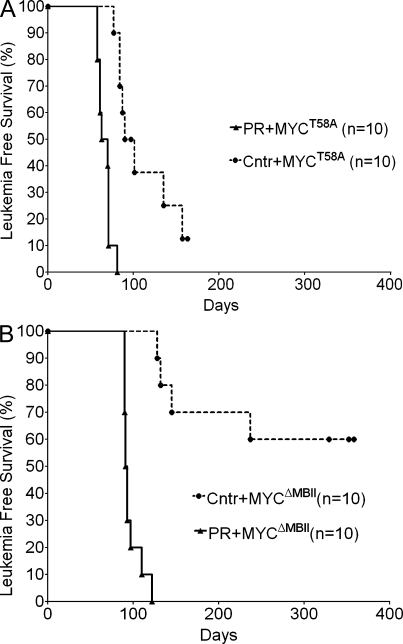
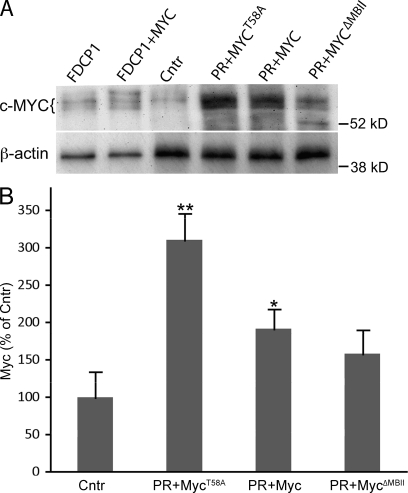
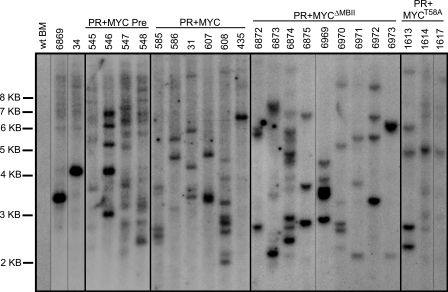
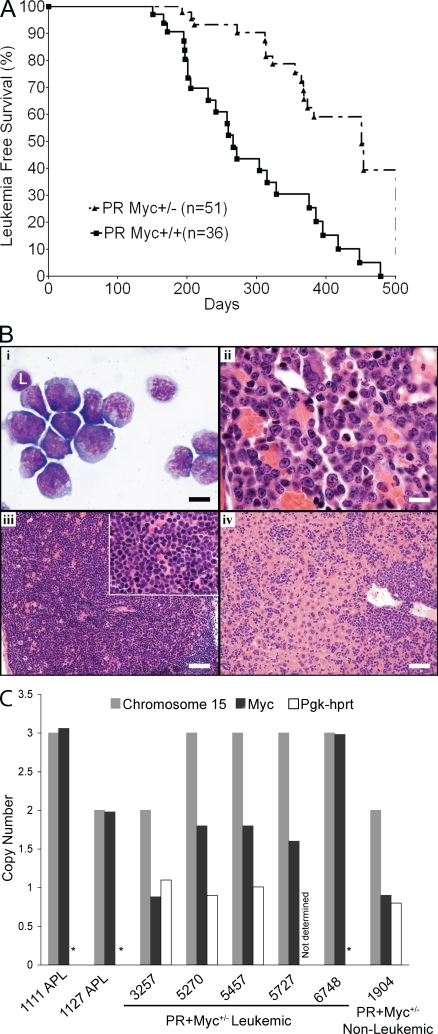
Gain of chromosome 8 is the most common chromosomal gain in human acute myeloid leukemia (AML). It has been hypothesized that gain of the MYC protooncogene is of central importance in trisomy 8, but the experimental data to support this are limited and controversial. In a mouse model of promyelocytic leukemia in which the MRP8 promoter drives expression of the PML-RARA fusion gene in myeloid cells, a Myc allele is gained in approximately two-thirds of cases as a result of trisomy for mouse chromosome 15. We used this model to test the idea that MYC underlies acquisition of trisomy in AML. We used a retroviral vector to drive expression of wild-type, hypermorphic, or hypomorphic MYC in bone marrow that expressed the PML-RARA transgene. MYC retroviruses cooperated in myeloid leukemogenesis and suppressed gain of chromosome 15. When the PML-RARA transgene was expressed in a Myc haploinsufficient background, we observed selection for increased copies of the wild-type Myc allele concomitant with leukemic transformation. In addition, we found that human myeloid leukemias with trisomy 8 have increased MYC. These data show that gain of MYC can contribute to the pathogenic effect of the most common trisomy of human AML.


Figures

Figure 1.
Figure 1.
MYC cooperates with PML-RARα to induce AML. (A) Bone marrow of PML-RARA mice (PR) was transduced with a retrovirus encoding MYC and GFP (MYC) or control retrovirus encoding GFP only (MIG) and introduced into lethally irradiated recipient mice. Combined results from two independent experiments for each group are shown. Median time to AML of 8 PML-RARα + MYC mice was 75 d (1 additional mouse developed T cell acute lymphoblastic leukemia/lymphoma (T-ALL) at 92 d; overall median time to illness 76 d). With longer latencies, some PML-RARα + MIG control retrovirus mice developed leukemia (four mice developed AML, one mouse developed T-ALL, and four mice were euthanized without leukemia or lymphoma). Control FVB/n (Cntr) + MYC mice developed lymphomas with a median latency of 90 d (7 mice developed T-ALL, 2 mice developed lymphoblastic lymphoma in the orbit (injection site), and 1 mouse was euthanized without evidence of leukemia or lymphoma). Differences in leukemia-free survival: PR+MIG versus PR+MYC, P < 0.0001; PR+MYC versus Cntr+MYC, P = NS. (B) Pathology of Cntr + Myc mouse. Results representative of nine lymphomas are shown. (i) Cytology of lymphoblastic cells from the lymph node of mouse #609. Histology of (ii) bone marrow of mouse #34, (iii) thymus of mouse #33, and (iv) liver of mouse #32. (i) Wright’s Giemsa stain. (ii-iv) H&E stain. Bars: (i) 8 µm; (ii) 12 µm; (iii and iv) 60 µm; (iii inset) 24 µm. (C) Immunophenotype of lymphoblastic lymphoma and APL. Splenocytes from a Control + MYC mouse (left; #609) and from a PML-RARα + MYC mouse (right; #608) were stained with the indicated antibodies. Plots are gated on GFP+ cells. Results representative of nine lymphomas and eight leukemias are shown. (D) Pathology of PML-RARα + MYC mouse. Results representative of eight leukemias are shown. (i) Cytology of leukemic cells from spleen of mouse #586. Pathology of (ii) bone marrow of mouse #478, (iii) spleen of mouse #478, and (iv) liver of mouse #478. (i) Wright’s Giemsa stain. (ii-iv) H&E stain. Bars: (i) 8 µm; (ii) 12 µm; (iii and iv) 60 µm; (iii inset) 24 µm.
Figure 2.
Figure 2.
PML-RARα and MYC cooperate to alter myeloid maturation. (A) Control (Cntr) or PML-RARA (PR) transgenic bone marrow was transduced with MIG (Cntr) or MYC retroviruses, and lethally irradiated mice were reconstituted with this bone marrow. 5 wk after transplantation, mice were euthanized and GFP+ cells were sorted from bone marrow and stained with Wright’s Giemsa stain. Results are representative of three to four animals per group. Bars, 8 µm. Each panel is comprised of two images of equal size, showing two different microscopic fields. L, Lymphocyte. (B) GFP+ bone marrow cells were stained as in A. 200 cell differential counts were performed. Percentages of cell types within the myeloid compartment are shown. Immat, Immature forms (blasts and promyelocytes); Intermed, myeloid intermediate forms; Neut, neutrophils; Mono, monocytes; Eos, eosinophils; n: Cntr+Cntr = 4; Cntr+MYC = 3; PR+Cntr = 4; PR+MYC = 3. Mice in each group were generated in single experiments. Means ± SD are shown. Differences in the percentages of intermediate forms and/or neutrophils were statistically significant for all comparisons except Cntr+Cntr versus Cntr+MYC. PR+MYC data for mature neutrophils differs from other three groups: PR+MYC versus Cntr+Cntr, P < 0.0001; PR+MYC versus Cntr+MYC, P < 0.01; PR+MYC versus PR+Cntr, P < 0.02. (C) Bone marrow cells from mice described in A were stained as described in Materials and methods. 34,000 GFP+ cells negative for lymphoid and erythroid antigens were analyzed for Gr-1 and CD34. Gr-1 and CD34 fluorescence histograms representative of three mice per group are shown. (D) Gr-1 and CD34 levels were analyzed in C. All values were normalized to Cntr+Cntr. Means ± SD are shown. n = 3 in each group. Mice in each group were generated in single experiments. *, P < .05; **, P < .01 for comparison to Cntr+Cntr; #, P < 0.05 PR+MYC versus PR+Cntr and P < 0.01 PR+MYC versus Cntr+MYC; ##, P < 0.01 PR+MYC versus Cntr+MYC.
Figure 3.
Figure 3.
MYC mutants cooperate with PML-RARα to induce AML. (A) Bone marrow of PML-RARA (PR) or control FVB/n (Cntr) mice was transduced with a retrovirus encoding MYCT58A and introduced into lethally irradiated recipient mice. Combined results from two independent experiments for each group are shown. Median time to APL of 10 PML-RARα + MYCT58A mice was 70 d. Control FVB/n + MYCT58A mice developed AML (5 mice), T-ALL (3 mice), or were euthanized without evidence of leukemia or lymphoma (2 mice). Median time to disease was 101 d. Difference in leukemia-free survival: P < 0.0001. (B) Bone marrow of PML-RARA (PR) or control FVB/n (Cntr) mice was transduced with a retrovirus encoding MYC with a deletion of the MBII domain (MYCΔMBII) and introduced into lethally irradiated recipient mice. Combined results from two independent experiments for each group are shown. Median time to APL of 10 PML-RARα + MYCΔMBII mice was 92 d. Control FVB/n + MYCΔMBII mice developed T-ALL (four mice) or were euthanized without evidence of leukemia or lymphoma (six mice). Difference in leukemia-free survival: P < 0.0001.
Figure 4.
Figure 4.
MYC protein levels in PML-RARα + MYC or MYC mutant leukemias. (A) Whole-cell lysates from normal bone marrow (Cntr) and PML-RARα + MYC, MYCT58A, or MYCΔMBII leukemic cells were probed with anti-MYC. The same blot was stripped and reprobed with anti–β-actin antibody for loading control. Cell lysates of FDC-P1 cells and FDC-P1 transduced with MYC are also shown. (B) Optical density of MYC protein was normalized to β-actin and shown as the percentage of MYC level in normal bone marrow (Cntr). Means ± SD are shown. n = 3 in each group. Normal bone marrows were from three normal FVB/n mice. Leukemic samples were from nine independent APLs arising from the survival experiments shown in Figs. 1 A, 3 A, and 3 B. Data were obtained from two independent immunoblots; each sample was analyzed once. *, P < .05; **, P < .01 for comparison to normal Cntr bone marrow.
Figure 5.
Figure 5.
Southern blot of PML-RARα + MYC leukemias shows clonal retroviral integrations. Genomic DNA samples were digested with EcoRI, which cuts within the multicloning site of retroviral integrants, and the blot was probed with a probe hybridizing to GFP sequences. 6989, A GFP+ leukemia that arose in a PML-RARα + MIG recipient mouse. 34, A GFP+ lymphoblastic lymphoma that arose in a recipient of Control + MYC-transduced bone marrow. PR+MYC Pre, preleukemic bone marrow from PML-RARα + MYC mice 5 wk after transplantation. PR+MYC, PR+MYCΔMBII, and PR+MYCT58A, leukemias that arose from recipients of PML-RARα bone marrow transduced with various MYC alleles. Data in this figure were obtained in three independent Southern blots. Thick vertical lines separate groups of samples and indicate juxtapositions of lanes. Thin vertical lines also indicate juxtaposition of lanes.
Figure 6.
Figure 6.
Haploinsufficiency for Myc delays leukemia development. (A) Bone marrows of PML-RARA Myc+/+ or PML-RARA Myc+/− FVB/n mice were harvested and transplanted into lethally irradiated FVB/n recipient animals. Combined results from eight (Myc+/+) or eleven (Myc+/−) independent transplantation experiments are shown. Mice were followed for the development of leukemia. Nonleukemic deaths were censored at the time of death. 67% of PML-RARA Myc+/+ deaths were from leukemia, whereas 31% of PML-RARA Myc+/− recipient mice died of leukemia. Median latency among leukemic animals was 258 d for Myc+/+ and 339 d for Myc+/−. P < 0.0001. (B) Morphology of leukemias arising in PML-RARA Myc+/− mice. Results representative of 16 leukemias are shown. (i) Cytology of leukemic cells from spleen of mouse #836. L, Lymphocyte. Histology of (ii) bone marrow of mouse #828, (iii) spleen of mouse #828, and (iv) liver of mouse #828. (i) Wright’s Giemsa stain. (ii-iv) H&E stain. Bars: (i) 8 µm; (ii) 12 µm; (iii and iv) 60 µm; (iii inset) 24 µm. (C) Gain of chromosome 15 and the wild-type Myc allele in PML-RARA Myc+/− leukemias. The number of copies of chromosome 15 as determined by cytogenetic analysis is indicated for each sample; 2 previously characterized leukemias (#1111 and #1127), 5 PR+Myc+/− leukemias, and 1 nonleukemic PR+Myc+/− marrow. Copy numbers for the wild-type Myc and Pgk-hprt alleles are also given for the same samples. Samples were run in triplicate in one to eight independent experiments. Pgk-hprt copy number could not be determined for leukemia #5727 because of insufficient quantity of DNA. *, Pgk-hprt copy number values are 0. Results for leukemia #836 showing no gain of chromosome 15, but increased copy-number for the wild-type Myc allele, are not shown here, but are included in Table I and discussed in the text.

Similar articles

Cited by

References

    1. Adams J.M., Harris A.W., Pinkert C.A., Corcoran L.M., Alexander W.S., Cory S., Palmiter R.D., Brinster R.L. 1985. The c-myc oncogene driven by immunoglobulin enhancers induces lymphoid malignancy in transgenic mice. Nature. 318:533–538 10.1038/318533a0 - DOI - PubMed
    1. Adhikary S., Eilers M. 2005. Transcriptional regulation and transformation by Myc proteins. Nat. Rev. Mol. Cell Biol. 6:635–645 10.1038/nrm1703 - DOI - PubMed
    1. Akagi T., Shih L.Y., Kato M., Kawamata N., Yamamoto G., Sanada M., Okamoto R., Miller C.W., Liang D.C., Ogawa S., Koeffler H.P. 2009. Hidden abnormalities and novel classification of t(15;17) acute promyelocytic leukemia (APL) based on genomic alterations. Blood. 113:1741–1748 10.1182/blood-2007-12-130260 - DOI - PMC - PubMed
    1. Barna M., Pusic A., Zollo O., Costa M., Kondrashov N., Rego E., Rao P.H., Ruggero D. 2008. Suppression of Myc oncogenic activity by ribosomal protein haploinsufficiency. Nature. 456:971–975 10.1038/nature07449 - DOI - PMC - PubMed
    1. Beroukhim R., Mermel C.H., Porter D., Wei G., Raychaudhuri S., Donovan J., Barretina J., Boehm J.S., Dobson J., Urashima M., et al. 2010. The landscape of somatic copy-number alteration across human cancers. Nature. 463:899–905 10.1038/nature08822 - DOI - PMC - PubMed

Publication types

Substances