

Increased B7-H1 expression on dendritic cells correlates with programmed death 1 expression on T cells in simian immunodeficiency virus-infected macaques and may contribute to T cell dysfunction and disease progression
- PMID: 21059890
- PMCID: PMC3716008
- DOI: 10.4049/jimmunol.1001642
Increased B7-H1 expression on dendritic cells correlates with programmed death 1 expression on T cells in simian immunodeficiency virus-infected macaques and may contribute to T cell dysfunction and disease progression
Abstract
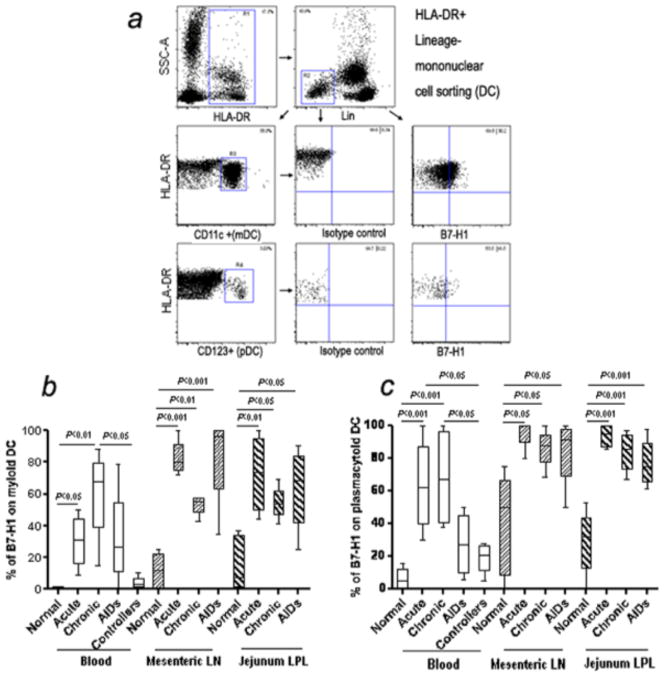
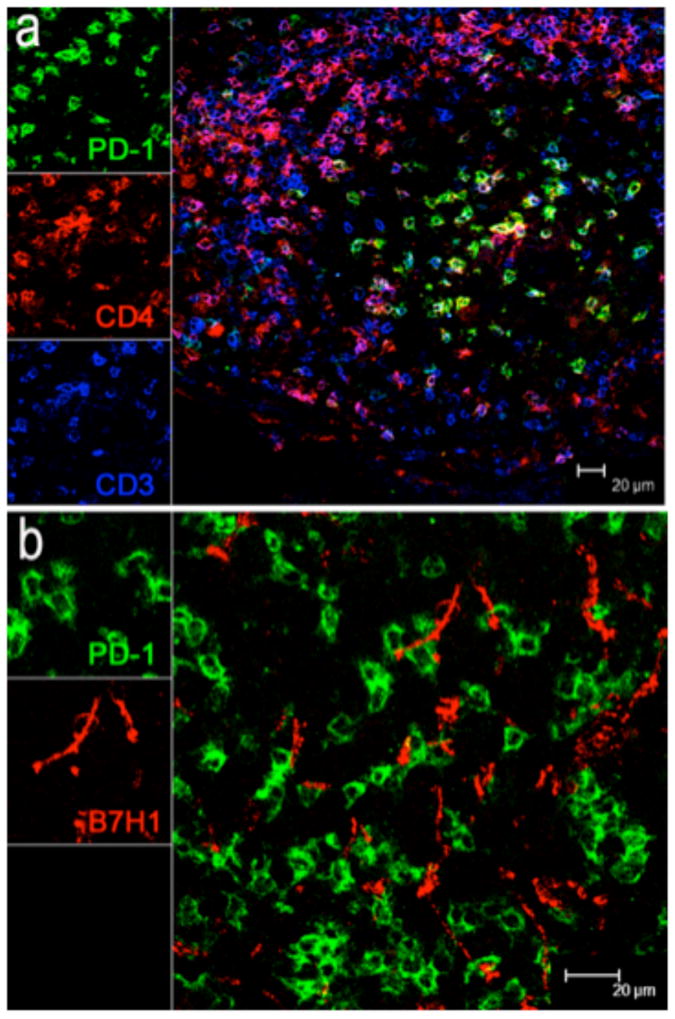
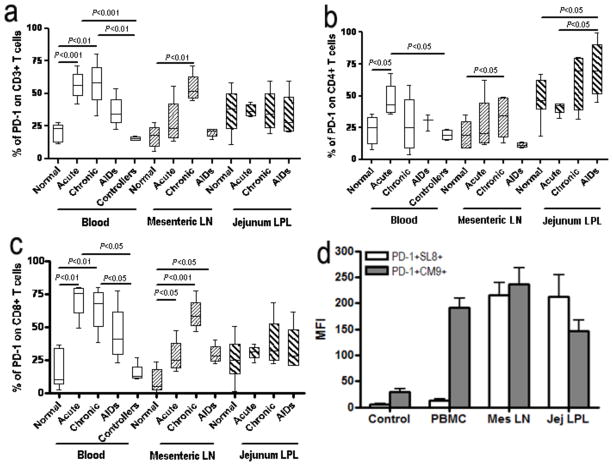
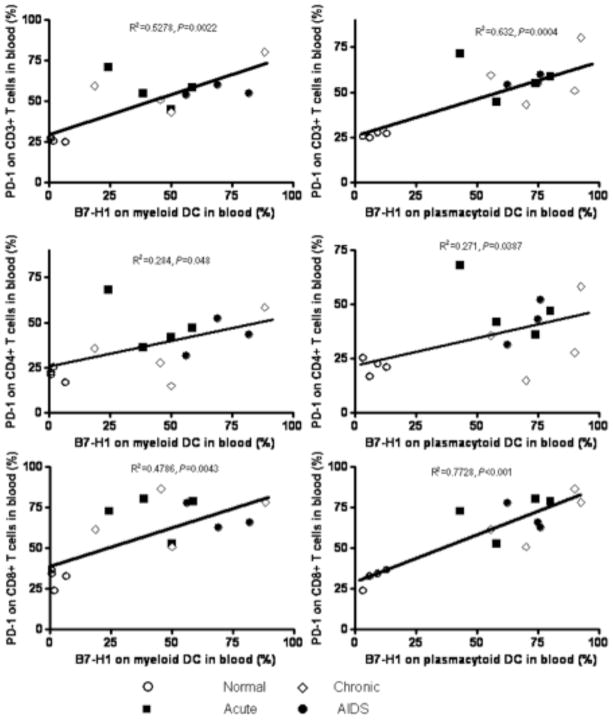
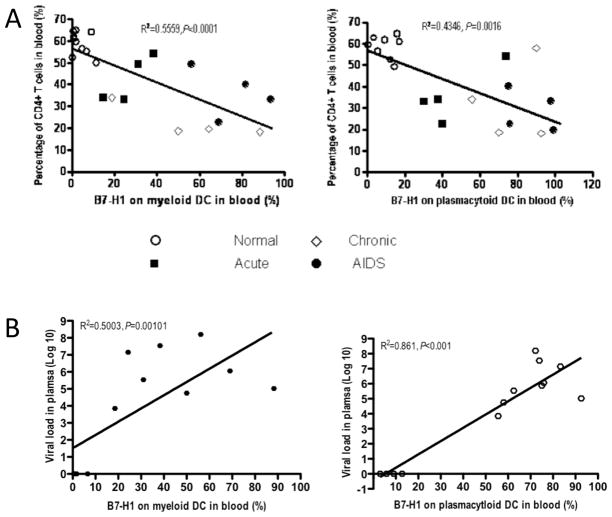
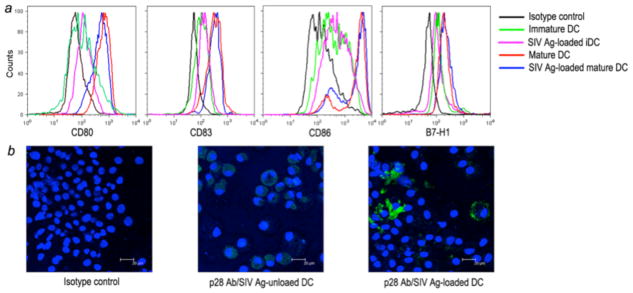
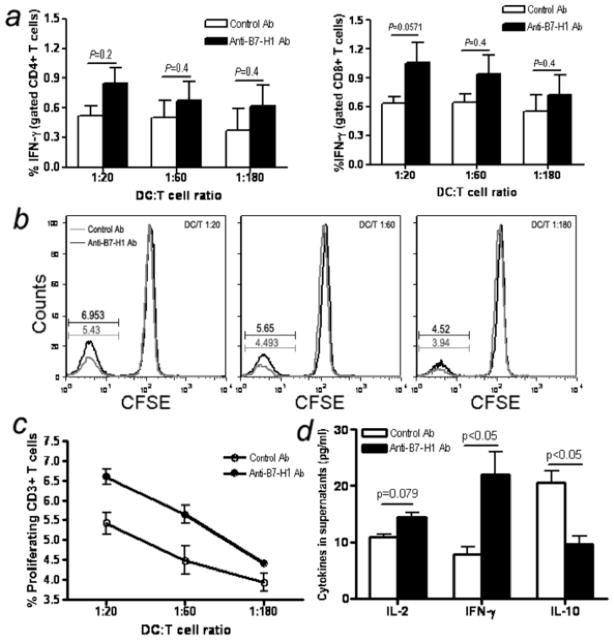
Suppression of dendritic cell (DC) function in HIV-1 infection is thought to contribute to inhibition of immune responses and disease progression, but the mechanism of this suppression remains undetermined. Using the rhesus macaque model, we show B7-H1 (programmed death [PD]-L1) is expressed on lymphoid and mucosal DCs (both myeloid DCs and plasmacytoid DCs), and its expression significantly increases after SIV infection. Meanwhile, its receptor, PD-1, is upregulated on T cells in both peripheral and mucosal tissues and maintained at high levels on SIV-specific CD8(+) T cell clones in chronic infection. However, both B7-H1 and PD-1 expression in SIV controllers was similar to that of controls. Expression of B7-H1 on both peripheral myeloid DCs and plasmacytoid DCs positively correlated with levels of PD-1 on circulating CD4(+) and CD8(+) T cells, viremia, and declining peripheral CD4(+) T cell levels in SIV-infected macaques. Importantly, blocking DC B7-H1 interaction with PD-1(+) T cells could restore SIV-specific CD4(+) and CD8(+) T cell function as evidenced by increased cytokine secretion and proliferative capacity. Combined, the results indicate that interaction of B7-H1-PD-1 between APCs and T cells correlates with impairment of CD4(+) Th cells and CTL responses in vivo, and all are associated with disease progression in SIV infection. Blockade of this pathway may have therapeutic implications for HIV-infected patients.
Figures

Similar articles
-
Elevated expression levels of inhibitory receptor programmed death 1 on simian immunodeficiency virus-specific CD8 T cells during chronic infection but not after vaccination.J Virol. 2007 Jun;81(11):5819-28. doi: 10.1128/JVI.00024-07. Epub 2007 Mar 21. J Virol. 2007. PMID: 17376899 Free PMC article.
-
SIV-specific CD8+ T cells express high levels of PD1 and cytokines but have impaired proliferative capacity in acute and chronic SIVmac251 infection.Blood. 2007 Aug 1;110(3):928-36. doi: 10.1182/blood-2007-01-069112. Epub 2007 Apr 17. Blood. 2007. PMID: 17440051 Free PMC article.
-
Overexpression of CD6 and PD-1 Identifies Dysfunctional CD8+ T-Cells During Chronic SIV Infection of Rhesus Macaques.Front Immunol. 2020 Jan 8;10:3005. doi: 10.3389/fimmu.2019.03005. eCollection 2019. Front Immunol. 2020. PMID: 31998302 Free PMC article.
-
Simian immunodeficiency virus interactions with macaque dendritic cells.Adv Exp Med Biol. 2013;762:155-81. doi: 10.1007/978-1-4614-4433-6_6. Adv Exp Med Biol. 2013. PMID: 22975875 Free PMC article. Review.
-
Dissecting the role of dendritic cells in simian immunodeficiency virus infection and AIDS.Immunol Res. 2011 Aug;50(2-3):228-34. doi: 10.1007/s12026-011-8220-3. Immunol Res. 2011. PMID: 21717075 Free PMC article. Review.
Cited by
-
Rapid down-regulation of γc on T cells in early SIV infection correlates with impairment of T-cell function.FASEB J. 2012 Jun;26(6):2294-305. doi: 10.1096/fj.11-195180. Epub 2012 Feb 28. FASEB J. 2012. PMID: 22375017 Free PMC article.
-
A change of PD-1/PD-L1 expression on peripheral T cell subsets correlates with the different stages of Alzheimer's Disease.Cell Biosci. 2022 Sep 30;12(1):162. doi: 10.1186/s13578-022-00897-1. Cell Biosci. 2022. PMID: 36180897 Free PMC article.
-
Immune Responses and Viral Persistence in Simian/Human Immunodeficiency Virus SHIV.C.CH848-Infected Rhesus Macaques.J Virol. 2021 Apr 12;95(9):e02198-20. doi: 10.1128/JVI.02198-20. Print 2021 Apr 12. J Virol. 2021. PMID: 33568508 Free PMC article.
-
Myeloid dendritic cells in HIV-1 infection.Curr Opin HIV AIDS. 2011 Sep;6(5):379-84. doi: 10.1097/COH.0b013e3283499d63. Curr Opin HIV AIDS. 2011. PMID: 21743323 Free PMC article. Review.
-
Th17 Cells Coordinate with Th22 Cells in Maintaining Homeostasis of Intestinal Tissues and both are Depleted in SIV-Infected Macaques.J AIDS Clin Res. 2014 May;5(5):302. doi: 10.4172/2155-6113.1000302. J AIDS Clin Res. 2014. PMID: 25364618 Free PMC article.
References
-
- Banchereau J, Steinman RM. Dendritic cells and the control of immunity. Nature. 1998;392:245–252. - PubMed
-
- Fearon DT, Locksley RM. The instructive role of innate immunity in the acquired immune response. Science. 1996;272:50–54. - PubMed
-
- Palucka K, Banchereau J. Dendritic cells: a link between innate and adaptive immunity. J Clin Immunol. 1999;19:12–25. - PubMed
-
- Onai N, Obata-Onai A, Schmid MA, Ohteki T, Jarrossay D, Manz MG. Identification of clonogenic common Flt3+M-CSFR+ plasmacytoid and conventional dendritic cell progenitors in mouse bone marrow. Nat Immunol. 2007;8:1207–1216. - PubMed
-
- Shortman K, Liu YJ. Mouse and human dendritic cell subtypes. Nat Rev Immunol. 2002;2:151–161. - PubMed
Publication types
MeSH terms
Substances
Grants and funding
LinkOut - more resources
Full Text Sources
Other Literature Sources
Research Materials
Miscellaneous
