. 2010 Nov 23;107(47):20523-8.
doi: 10.1073/pnas.1006869107. Epub 2010 Nov 8.

Deficits in axonal transport precede ALS symptoms in vivo

Affiliations

Deficits in axonal transport precede ALS symptoms in vivo

Lynsey G Bilsland et al. Proc Natl Acad Sci U S A. .

Abstract

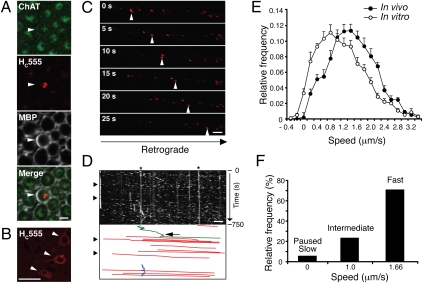
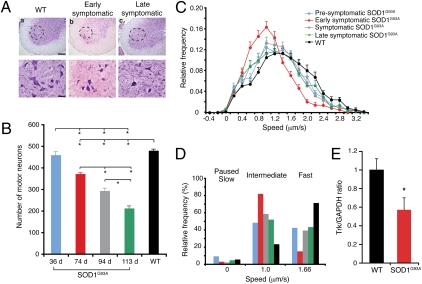
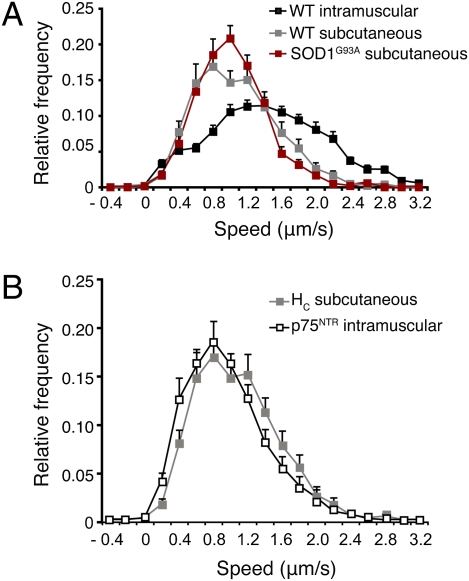
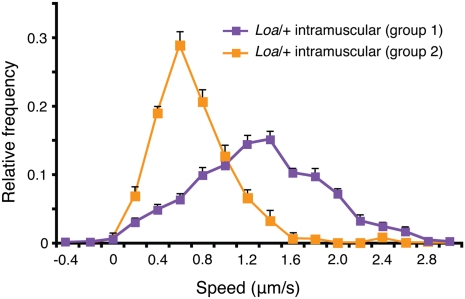
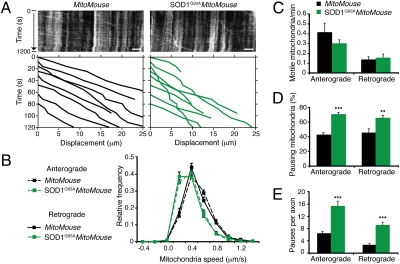
ALS is a fatal neurodegenerative disease characterized by selective motor neuron death resulting in muscle paralysis. Mutations in superoxide dismutase 1 (SOD1) are responsible for a subset of familial cases of ALS. Although evidence from transgenic mice expressing human mutant SOD1(G93A) suggests that axonal transport defects may contribute to ALS pathogenesis, our understanding of how these relate to disease progression remains unclear. Using an in vivo assay that allows the characterization of axonal transport in single axons in the intact sciatic nerve, we have identified clear axonal transport deficits in presymptomatic mutant mice. An impairment of axonal retrograde transport may therefore represent one of the earliest axonal pathologies in SOD1(G93A) mice, which worsens at an early symptomatic stage. A deficit in axonal transport may therefore be a key pathogenic event in ALS and an early disease indicator of motor neuron degeneration.


Conflict of interest statement

The authors declare no conflict of interest.

Figures

Fig. 1.
Fig. 1.
Characterization of in vivo axonal retrograde transport in WT mice. (A) After i.m. injection, HC555 was found within axons in transverse sections through the sciatic nerve, which costained for ChAT, an MN marker. Myelin sheaths were stained for myelin basic protein (MBP). (Scale bar, 5 μm.) (B) HC555 was visible within the somas of lumbar MNs (arrowheads). (Scale bar, 50 μm.) (C) Images (movie stills) of axonal transport of HC555 in the sciatic nerve were acquired by time-lapse confocal microscopy. (D) Corresponding kymograph. Retrograde carriers were moving to the right (arrowheads). Below the kymograph is a scheme reporting manually drawn lines tracing the movement of retrograde carriers (in red). Stationary carriers, labeled by asterisks, and carriers moving briefly in the anterograde direction (arrow; in green) or oscillating (in blue) were also present. (Scale bar, 5 μm.) (E) Comparison of the speed profiles of the HC555 carriers in single axons revealed that retrograde transport was faster in vivo (filled circles; 258 carriers; 44 axons, n = 5 independent experiments) than in vitro (empty circles; 383 carriers; 32 axons, n = 5 independent cultures), with three defined speed components at 0–0.33 (slow), 1.0 (intermediate), and 1.66 μm/s (fast). The fastest speed component provided the major contribution to the overall speed profile of HC555 carriers (F). Error bars represent SEM.
Fig. 2.
Fig. 2.
Retrograde transport was reduced in SOD1G93A mice. Disease stages were characterized by assessing MN loss. (A) Nissl-stained spinal cord sections, showing MNs in the sciatic motor pool (dashed areas, magnified below) of (a) WT, (b) early symptomatic, and (c) late symptomatic SOD1G93A mice. [Scale bars, 200 μm (Upper) or 50 μm (Lower).] (B) No MN loss was detected at a presymptomatic stage, although death increased as disease progressed (n = 6). (C) Retrograde transport in single axons was assessed at four defined disease stages [presymptomatic (36 ± 0.95 d; 344 carriers; 52 axons, n = 6), early symptomatic (74 ± 1.7 d; 193 carriers; 39 axons, n = 5), symptomatic (95 ± 1.4 d; 250 carriers; 41 axons, n = 6), and late symptomatic (113 ± 3.5 d; 175 carriers; 31 axons, n = 4)] and in control WT mice (38-125 d; 258 carriers; 44 axons, n = 5). SOD1G93A mice displayed a significant impairment in retrograde transport at a presymptomatic stage, which worsened by an early symptomatic stage. (D) Deconvolution analysis of the speed profiles. The slowing of transport in SOD1G93A mice was due to a reduction in the fastest speed component and an increase in the intermediate component compared with WT. (E) Quantification of the TrkB antibody accumulated in the ligated sciatic nerve after i.m. injection also revealed a significant deficit in the axonal transport of this neurotrophin receptor in early symptomatic SOD1G93A mice compared with WT. Bars represent the average TrkB signal normalized to GAPDH. Error bars represent SEM. *P < 0.005 or below (n = 3–6).
Fig. 3.
Fig. 3.
In vivo analysis of axonal retrograde transport in sensory neurons. (A) s.c. injection allowed the selective endocytosis and retrograde transport of HC555 in sensory neurons. HC555 transport was significantly slower than that observed after i.m. injection. However, the transport kinetics in sensory neurons did not differ between WT (218 carriers; 27 axons, n = 3) and early symptomatic SOD1G93A mice (215 carriers; 31 axons, n = 3). (B) Retrograde transport of AlexaFluor555-labeled anti-p75NTR antibody injected i.m. was very similar to that of HC555 after s.c. injection, thus implying that this p75NTR antibody was specifically transported in sensory axons. Error bars represent SEM.
Fig. 4.
Fig. 4.
Axonal transport deficits are evident in Loa/+ mice. Analysis of retrograde transport of HC555 after i.m. injection in Loa/+ mice revealed two populations of carriers. The first population (in purple; 93 carriers; 16 axons, n = 2) had a speed profile almost indistinguishable from that of HC555 upon i.m. injection in WT mice (Fig. 2C). The second population (in orange; 147 carriers; 14 axons, n = 2) had a speed profile slower than HC555 transport in sensory axons after s.c. injection (Fig. 3A). Error bars represent SEM.
Fig. 5.
Fig. 5.
Mitochondrial transport is affected in SOD1G93A mice at a presymptomatic stage. Movement of CFP-tagged mitochondria was monitored in sciatic nerves of MitoMouse and SOD1G93AMitoMouse mutants. (A) Examples of corresponding kymographs. Anterograde mitochondria were moving to the right. Lower: Representative traces of some of the tracked mitochondria. (Scale bar, 5 μm.) (B) SOD1G93AMitoMouse axons displayed a significant impairment in both anterograde and retrograde transport of mitochondria (856 anterograde mitochondria in 161 axons and 380 retrograde mitochondria in 119 axons; n = 4) at a presymptomatic stage compared with MitoMouse littermates (670 anterograde mitochondria in 96 axons and 156 retrograde mitochondria in 61 axons; n = 3). (C) Kinetic analysis revealed no significant differences in the frequency of transported mitochondria in the sciatic nerve of SOD1G93AMitoMouse and MitoMouse littermates. However, a higher percentage of mitochondria paused during transport in SOD1G93AMitoMouse compared with MitoMouse controls (D), and more mitochondrial pauses per axon were also detected in SOD1G93AMitoMouse than in controls (E), as also shown in A. Error bars represent SEM. **P < 0.01, ***P < 0.001.

References

    1. Goldstein LS, Yang Z. Microtubule-based transport systems in neurons: The roles of kinesins and dyneins. Annu Rev Neurosci. 2000;23:39–71. - PubMed
    1. Chevalier-Larsen E, Holzbaur EL. Axonal transport and neurodegenerative disease. Biochim Biophys Acta. 2006;1762:1094–1108. - PubMed
    1. De Vos KJ, Grierson AJ, Ackerley S, Miller CC. Role of axonal transport in neurodegenerative diseases. Annu Rev Neurosci. 2008;31:151–173. - PubMed
    1. Morfini GA, et al. Axonal transport defects in neurodegenerative diseases. J Neurosci. 2009;29:12776–12786. - PMC - PubMed
    1. Xia CH, et al. Abnormal neurofilament transport caused by targeted disruption of neuronal kinesin heavy chain KIF5A. J Cell Biol. 2003;161:55–66. - PMC - PubMed

Publication types