. 2011 Jun;21(6):1311-30.
doi: 10.1093/cercor/bhq212. Epub 2010 Nov 8.

A lifespan analysis of intraneocortical connections and gene expression in the mouse I

Affiliations

A lifespan analysis of intraneocortical connections and gene expression in the mouse I

Catherine A Dye et al. Cereb Cortex. 2011 Jun.

Abstract

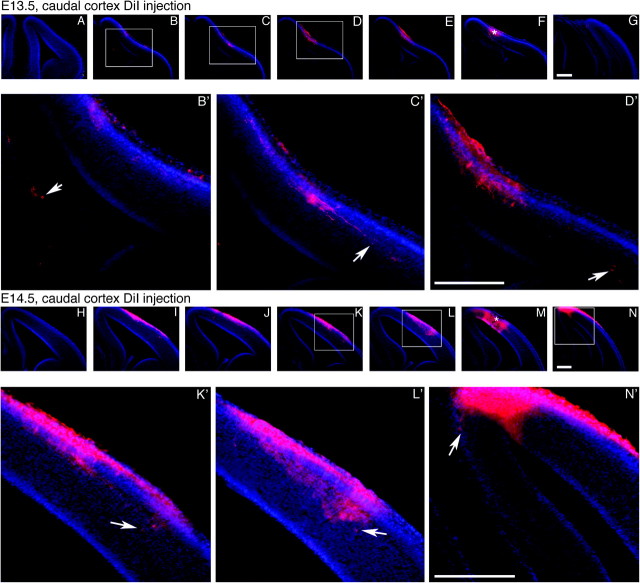
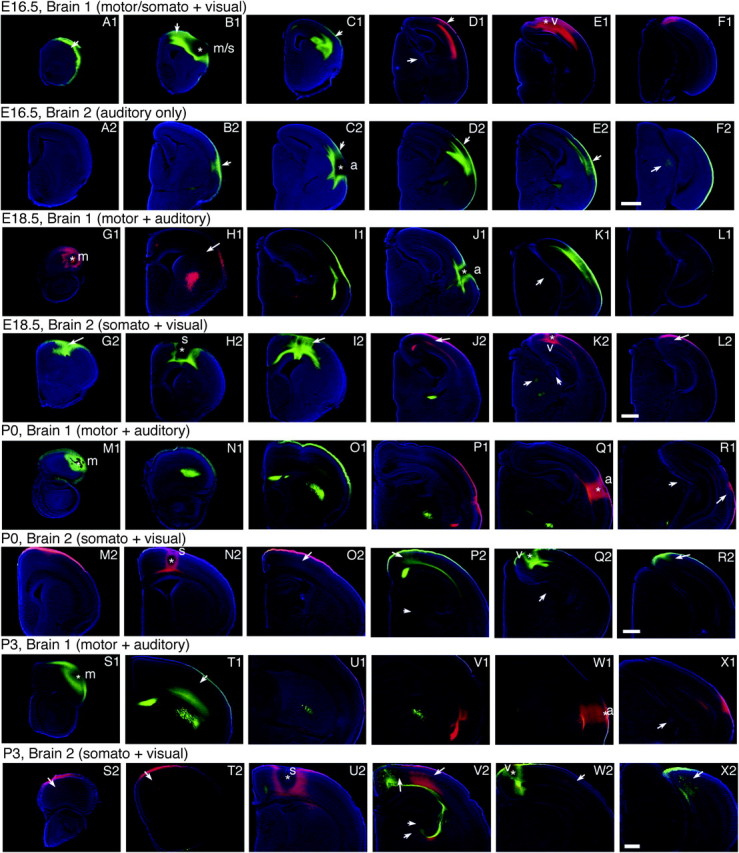
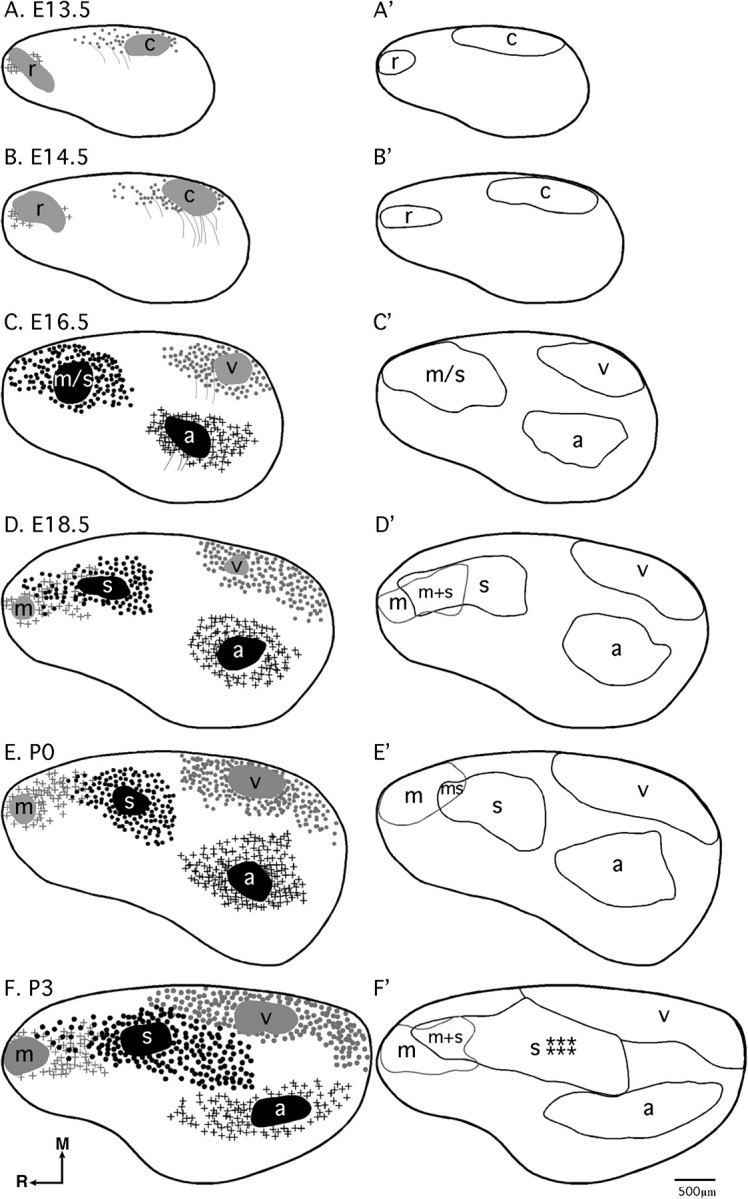
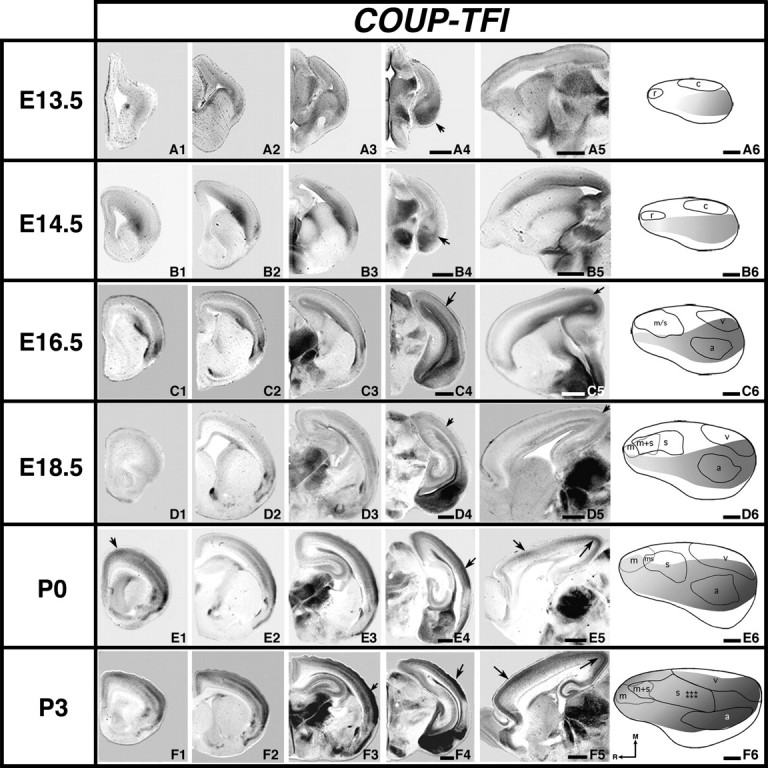
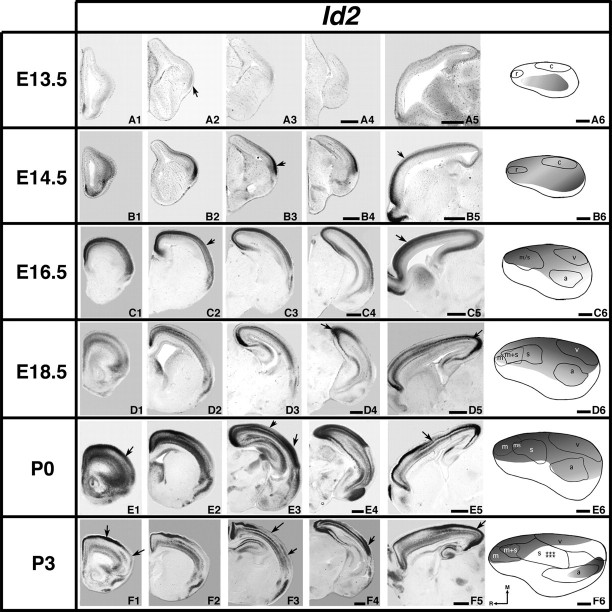
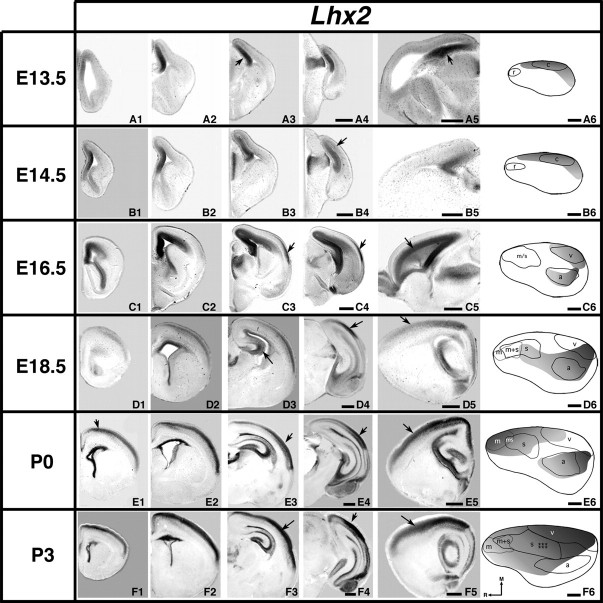
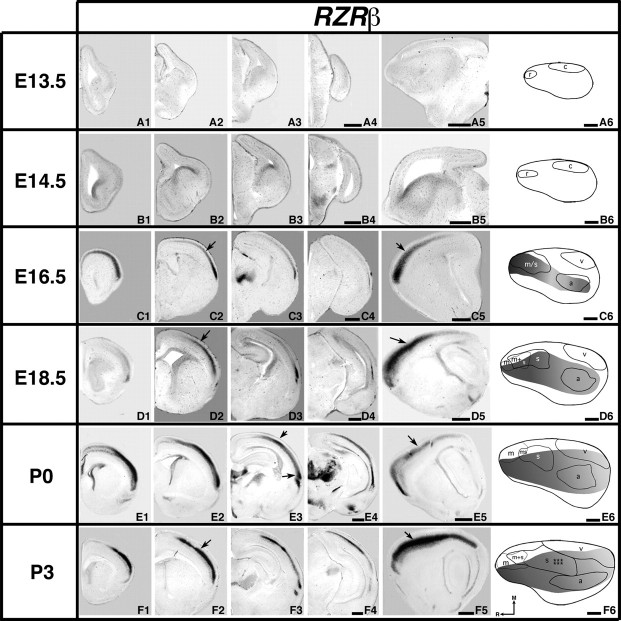
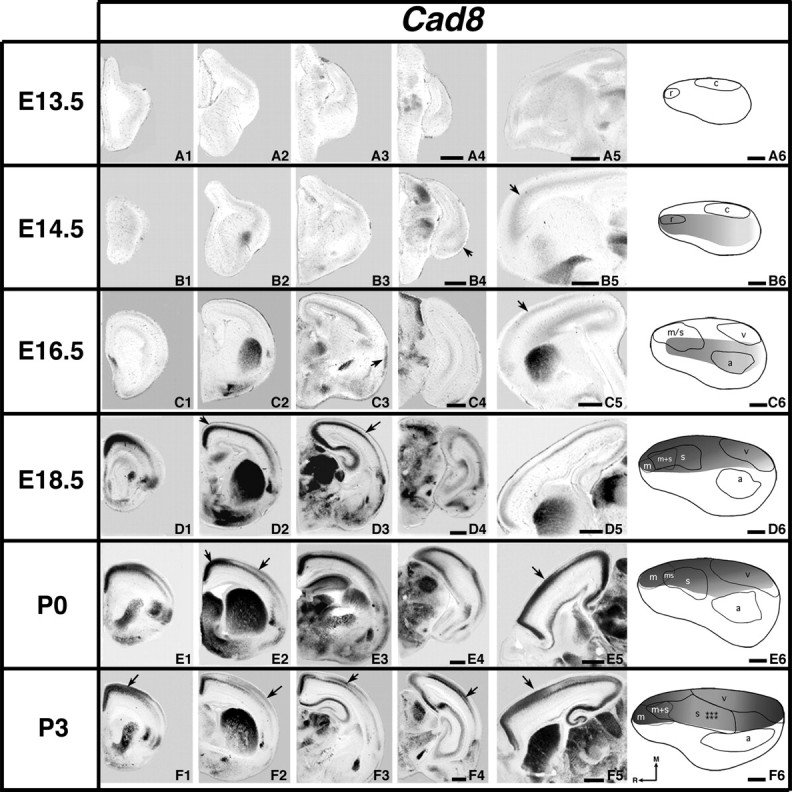
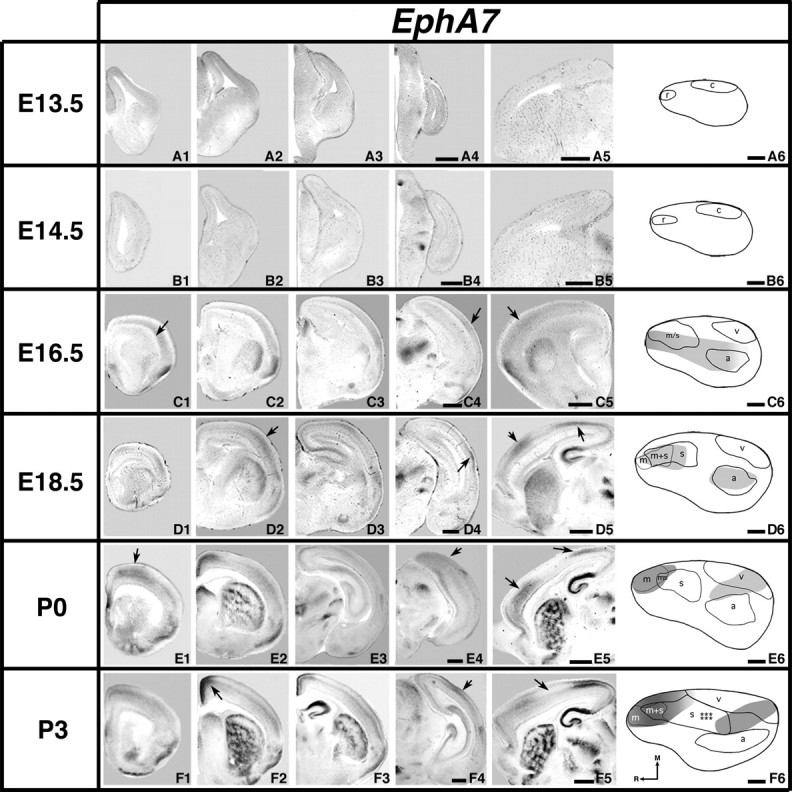
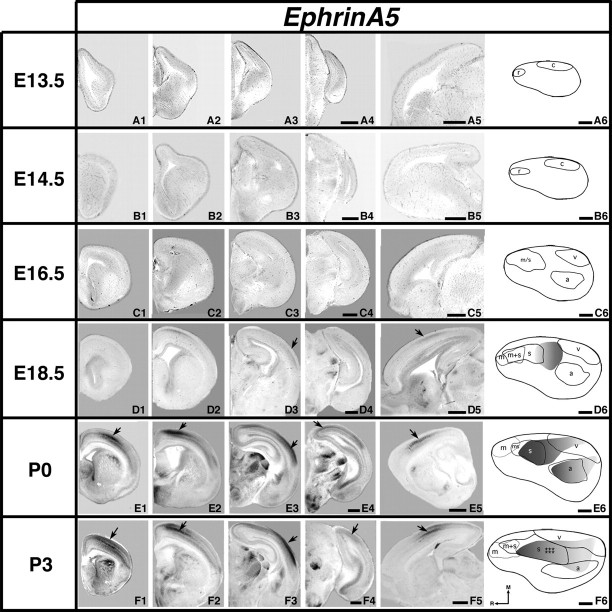
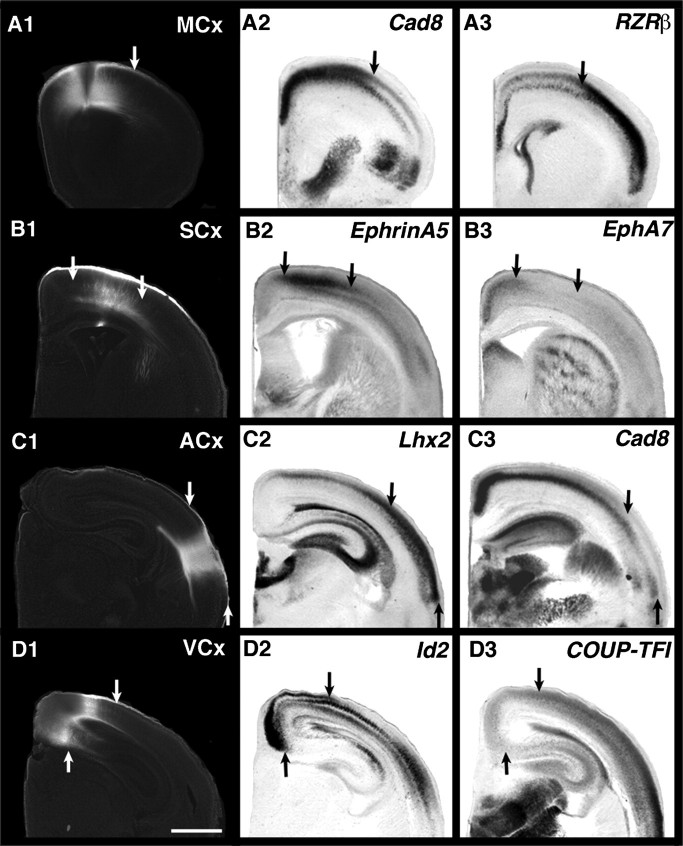
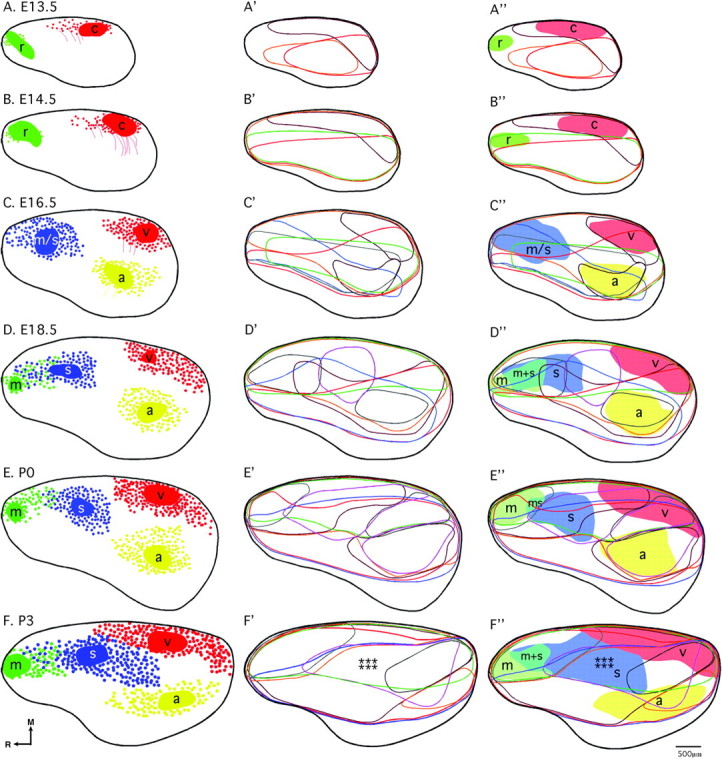
A hallmark of mammalian evolution is the structural and functional complexity of the cerebral cortex. Within the cerebral cortex, the neocortex, or isocortex, is a 6-layered complexly organized structure that is comprised of multiple interconnected sensory and motor areas. These areas and their precise patterns of connections arise during development, through a process termed arealization. Intrinsic, activity-independent and extrinsic, activity-dependent mechanisms are involved in the development of neocortical areas and their connections. The intrinsic molecular mechanisms involved in the establishment of this sophisticated network are not fully understood. In this report (I) and the companion report (II), we present the first lifespan analysis of ipsilateral intraneocortical connections (INCs) among multiple sensory and motor regions, from the embryonic period to adulthood in the mouse. Additionally, we characterize the neocortical expression patterns of several developmentally regulated genes that are of central importance to studies investigating the molecular control of arealization from embryonic day 13.5 to postnatal day (P) 3 (I) and P6 to 50 (II). In this analysis, we utilize novel methods to correlate the boundaries of gene expression with INCs and developing areal boundaries, in order to better understand the nature of gene-areal relationships during development.


Figures

Figure 1.
Figure 1.
Analysis of INC formation during mid-embryogenesis; 100-μm coronal sections of E13.5 (AG) or E14.5 (HN) brain hemispheres following DiI crystal placement in the putative visual cortex, presented in a rostral to caudal series, oriented with dorsal up and lateral to the right. Boxed areas are shown at higher magnification in (B′–D′) and (K′–N′). Arrows indicate red DiI-labeled tangential processes and retrogradely labeled soma. At E13.5 (AG), cells are found as far medially as the cingulate cortex, and the extent of retrogradely labeled cells extends a significant distance rostrally from the DPL (dye placement location). Retrogradely labeled cells are found at locations rostral (KL) or caudal (N) to the DPL at E14.5, with the greatest number of cells present immediately rostral to the DPL. “*” Denotes DPL. Scale bars = 350μm.
Figure 2.
Figure 2.
Analysis of INC formation during late embryogenesis and postnatal stages; 100-μm coronal sections of E16.5 (A1–F1, A2–F2), E18.5 (G1–L1, G2–L2), P0 (M1–R1, M2–R2), and P3 (S1–X1, S2–X2) hemispheres following DiI or DiA dye placement, conventions as in previous. E16.5, Brain 1: DPLs in putative somatosensory/motor (B1) and visual (E1) cortex; Brain 2: DPL in presumptive auditory cortex (C2). For ages E18.5–P3, Brain 1 DPLs in motor (G1, M1, S1) and auditory cortex (J1, Q1, W1); Brain 2 DPLs in somatosensory (H2, N2, U2) and visual cortex (K2, Q2, W2). Thalamic arrows indicate retrogradely labeled cells in the following nuclei: LGN (D1 medial, K2, Q2, and V2 lateral); medial geniculate nucleus (F2, K1, R1 medial, and X1); ventral posterior nucleus (K2 medial, P2 ventral, and V2 medial). Top left arrow in V2 indicates the visual–somatosensory boundary. All other arrows indicate retrogradely labeled cells. m, putative motor; s, putative somatosensory; a, putative auditory; and v, putative visual areas. Scale bars = 500 μm.
Figure 3.
Figure 3.
Reconstruction of areal boundaries through analysis of INCs. All panels represent a lateral view of one hemisphere. Panels (AF) DPLs and organization of retrogradely labeled cells (black or gray patches = DPL plus dye spread; gray filled circles = retrogradely labeled cells in putative caudal/visual cortex; gray lines = processes; gray plus signs = retrogradely labeled cells in putative rostral/motor cortex; black filled circles: retrogradely labeled cells in putative motor/somatosensory or somatosensory cortex; black plus signs= retrogradely labeled cells in putative auditory cortex; thick black line = hemisphere outline). Panels (A′–F′): lateral view reconstructions of putative areal boundaries as determined by INC analyses (gray and black lines = putative cortical areas as labeled; r, putative rostral area; c, putative caudal area; m, putative motor cortex; m + s, putative sensory–motor amalgam; m/s or s, putative motor/somatosensory or somatosensory cortex; a, putative auditory cortex; v, putative visual cortex). Stars denote location of putative barrel field. Oriented medial (M) up and rostral (R) to the left. Scale bar = 500 μm.
Figure 4.
Figure 4.
Analysis of neocortical gene expression of COUP-TFI; 100 μm rostral to caudal coronal series (A to F1–4) or sagittal (A5–F5) sections of E13.5 (A1–5), E14.5 (B1–5), E16.5 (C1–5), E18.5 (D1–5), P0 (E1–5), or P3 (F1–5) brain hemispheres after in situ hybridization with a probe for COUP-TFI, oriented with dorsal up (all sections) and medial (A to F1–4) or rostral (A5–F5) to the left. Panels A6–F6 show lateral view reconstructions within one hemisphere of gene expression gradients or gene maps (gray shaded areas) coregistered with areal reconstructions at each age. Other conventions as in previous. COUP-TFI is observed at E13.5 (A4 arrow: caudo/lateral expression) to P3 in a rostral to caudal lateral gradient. Expression is present at later ages in a caudal region (arrows in B4, C4–5, D4–5, E4, F3–4), a rostral region (E1, E5, and F5 rostral arrows), and caudomedial region (E5, F5 caudal arrows). Scale bars = 500 μm.
Figure 5.
Figure 5.
Analysis of neocortical gene expression of Id2; 100 μm coronal (A to F1–4) or sagittal (A5–F5) sections and gene maps (A6–F6) of E13.5–P3 brain hemispheres after in situ hybridization with a probe for Id2, with conventions as in previous. Id2 expression is observed from E13.5 to P3. E13.5 expression is most pronounced laterally (A2, arrow). Strong expression is observed laterally, rostrally, and medially at E14.5–E16.5 (B3, B5, C2, C5, arrows). E18.5–P3 shows increased laminar complexity of expression. D4–5, E1, E3 lateral, E5, F5 arrows: regions of strong expression. Low superficial expression corresponds to the putative barrel field (E3, F3 medial arrows) in contrast with a rostral region of strong superficial expression (F1 medial arrow) that is not maintained laterally (F1 lateral arrow). F3–4 lateral arrows: distinct lateral domain of expression correlated with auditory cortex. Scale bars = 500 μm.
Figure 6.
Figure 6.
Analysis of neocortical gene expression of Lhx2; 100 μm coronal (A to F1–4) or sagittal (A5–F5) sections and gene maps (A6–F6) of E13.5–P3 brain hemispheres after in situ hybridization with a probe for Lhx2, with conventions as in previous. Lhx2 is expressed from E13.5 to P3. At early ages, expression is confined primarily to the most medial regions of the cortex (arrows in A3, A5, B4 and A6–B6). At E16.5 (C3–C4, arrows), a lateral domain of expression emerges. Medial wall expression decreases at later ages (D3, arrow), while lateral expression in superficial layers spreads and increases in intensity. C5, D4, D5, E5, and F5 arrows: gradients of expression. E1, E3, E4 and F4 arrows: robust expression along the rostral/caudal extent of the neocortex, including the putative auditory cortex (E6). F3 arrow: strong expression in the developing barrel field. Scale bars = 500 μm.
Figure 7.
Figure 7.
Analysis of neocortical gene expression of RZRß; 100 μm coronal (AF1–4) or sagittal (A5–F5) sections and gene maps (A6–F6) of E13.5–P3 brain hemispheres after in situ hybridization with a probe for RZRß, with conventions as in previous. RZRß expression is first detected within the developing neocortex at E16.5 (C2, C5, arrows). Rostromedial expression is reduced at later ages but caudolateral expression strengthens and expands (D6–F6). D2, D5, E5, and F5 arrows indicate the expression gradient. E3 arrows: nonuniform expression along the medial/lateral extent, F2 arrow: robust expression in the developing barrel field. Scale bars = 500 μm.
Figure 8.
Figure 8.
Analysis of neocortical gene expression of Cad8; 100 μm coronal (AF1–4) or sagittal (A5–F5) sections and gene maps (A6–F6) of E13.5–P3 brain hemispheres after in situ hybridization with a probe for Cad8, with conventions as in previous. Cad8 expression is first detected at E14.5 (B4–B5, arrows). Expression remains low at E16.5 (C5, arrow). A uniform gradient with levels highest medially is observed at E18.5; at later ages, distinct domains of expression are also observed. D2, D3, F1, F3–F4, and lateral E2 arrows: gradients of gene expression. E2 medial and E5 arrow: domains of strong medial expression, F2 arrow: weak expression in developing barrel field. Scale bars = 500 μm.
Figure 9.
Figure 9.
Analysis of neocortical gene expression of EphA7; 100 μm coronal (AF1–4) or sagittal (A5–F5) sections and gene maps (A6–F6) of E13.5–P3 brain hemispheres after in situ hybridization with a probe for EphA7, with conventions as in previous. EphA7 is first detected in the neocortex at E16.5 (C1, C4–C5, arrows). At E18.5 and older, expression is present rostrally and caudally, but excluded from the putative somatosensory barrel field. D4, E4, and F4 arrows: caudal expression domains. D5 and E5 arrows: rostral/caudal expression separated by island of weak expression. D2, E1, and F2 arrows: rostromedial/medial expression domains. F5 arrows/F6 stars: EphA7-negative domain at the location of the developing barrel fields. Scale bars = 500 μm.
Figure 10.
Figure 10.
Analysis of neocortical gene expression of EphrinA5; 100 μm coronal (AF1–4) or sagittal (A5–F5) and gene maps (A6–F6) of E13.5–P3 brain hemispheres after in situ hybridization with a probe for EphrinA5, with conventions as in previous. EphrinA5 expression in the neocortex is first detected at E18.5, with low levels of transcripts found laterally and in the putative somatosensory barrel field (D3 and D5, arrows). At later ages, levels of expression increase in intensity while the distribution of transcripts remains similar. E1–4 arrows: gradients of expression; E5 and F5 arrows: putative somatosensory barrel field. F1–3 arrows: regions of strong expression moving caudally and laterally. F4 arrow: expression in putative visual cortex. Scale bars = 500 μm.
Figure 11.
Figure 11.
A coregistration of INCs and gene expression at P0; 100-μm coronal DiI sections shown alongside adjacent in situ hybridization sections, with dorsal up, lateral to the right. A1–A3: DPL and INCs in rostral–medial cortex demonstrate the location of putative motor cortex (A1), the boundaries of which coregister with opposing expression boundaries of Cad8 (A2) and RZRß (A3). B1–B3: DPL and INCs in rostral cortex demonstrate the location of the rostral portion of putative somatosensory cortex (B1), the boundary of which coregisters with the EphrinA5 (B2) and the opposing EphA7 (B3) expression boundaries. C1–C3: DPL and INCs in lateral cortex demonstrate the location of putative auditory cortex (C1), the boundary of which coregisters with complementary boundaries of Lhx2 (C2) and Cad8 (C3) expression. D1–D3: DPL and INCs in medial cortex demonstrate the location of putative rostral–medial visual cortex (D1), which coregisters with complementary boundaries of Id2 (D2) and COUP-TFI (D3) expression. Arrows in A1–3, B1–3, C1–3, and D1–3 indicate the rostral–lateral boundary of putative motor cortex, the medial and lateral boundaries of putative rostral somatosensory cortex, the medial boundary of putative auditory cortex, and the medial and lateral boundaries of the rostral portion of putative visual cortex, respectively. Scale bar =1 mm.
Figure 12.
Figure 12.
INC and gene expression relationships revealed by a novel, flattened reconstruction approach. Analysis of the relationships between INCs and neocortical gene expression was conducted through design of flattened reconstructions of INCs (AF), and gene expression patterns (A′–F′) and coregistrations of the 2 data sets (A''–F''), where putative areal boundaries are shaded. In all 3 columns, similar ages are presented from left to right as follows: AA'', E13.5; BB'', E14.5; CC'', E16.5; DD'', E18.5; EE'', P0; FF'', P3. AF (colored patches= DPL plus dye spread; red filled circles = retrogradely labeled cells in putative caudal/visual cortex; thin colored lines = processes; green filled circles= retrogradely labeled cells in putative rostral/motor cortex; blue filled circles: retrogradely labeled cells in putative motor/somatosensory or somatosensory cortex; yellow filled circles = retrogradely labeled cells in putative auditory cortex; thick black line = hemisphere outline). In A'–F' and A''–F'', the flattened, reconstructed expression of each gene is represented by a colored line as follows: COUP-TFI, red; Id2, orange; Lhx2, burgundy; RZRß, blue; Cad8, green; EphA7, gray; EphrinA5, purple. The pastel shaded regions in A''–F'' denote putative area boundaries of sensory and motor areas, determined from the patterns of INCs, as labeled (r, putative rostral area; c, putative caudal area; m, putative motor cortex; m + s, putative sensory-motor amalgam; m/s or s, putative motor/somatosensory or somatosensory cortex; a, putative auditory cortex; v, putative visual cortex). Stars denote location of putative barrel field. Oriented medial (M) up and rostral (R) to the left. Scale bar = 500μm.

Similar articles

Cited by

References

    1. Abu-Khalil A, Fu L, Grove EA, Zecevic N, Geschwind DH. Wnt genes define distinct boundaries in the developing human brain: implications for human forebrain patterning. J Comp Neurol. 2004;474:276–288. - PubMed
    1. Armentano M, Chou SJ, Tomassy GS, Leingärtner A, O'Leary DD, Studer M. COUP-TFI regulates the balance of cortical patterning between frontal/motor and sensory areas. Nat Neurosci. 2007;10:1277–1286. - PubMed
    1. Auladell C, Pérez-Sust P, Supèr H, Soriano E. The early development of thalamocortical and corticothalamic projections in the mouse. Anat Embryol. 2000;201:169–179. - PubMed
    1. Bai W, Ishida M, Okabe M, Arimatsu Y. Role of the protomap and target-derived signals in the development of intrahemispheric connections. Cereb Cortex. 2006;16:124–135. - PubMed
    1. Bishop K, Goudreau G, O'Leary DD. Regulation of area identity in the mammalian neocortex by Emx2 and Pax6. Science. 2000;288:344–349. - PubMed

Publication types

MeSH terms