. 2011 Jun;21(6):1331-50.
doi: 10.1093/cercor/bhq213. Epub 2010 Nov 8.

A lifespan analysis of intraneocortical connections and gene expression in the mouse II

Affiliations

A lifespan analysis of intraneocortical connections and gene expression in the mouse II

Catherine A Dye et al. Cereb Cortex. 2011 Jun.

Abstract

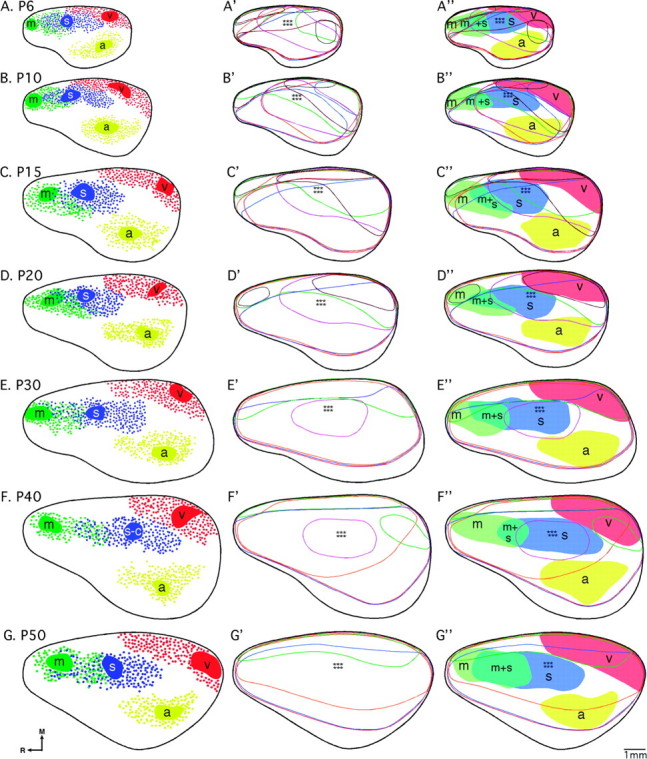
The mammalian neocortex contains an intricate processing network of multiple sensory and motor areas that allows the animal to engage in complex behaviors. These anatomically and functionally unique areas and their distinct connections arise during early development, through a process termed arealization. Both intrinsic, activity-independent and extrinsic, activity-dependent mechanisms drive arealization, much of which occurs during the areal patterning period (APP) from late embryogenesis to early postnatal life. How areal boundaries and their connections develop and change from infancy to adulthood is not known. Additionally, the adult patterns of sensory and motor ipsilateral intraneocortical connections (INCs) have not been thoroughly characterized in the mouse. In this report and its companion (I), we present the first lifespan analysis of ipsilateral INCs among multiple sensory and motor regions in mouse. We describe the neocortical expression patterns of several developmentally regulated genes that are of central importance to studies investigating the molecular regulation of arealization, from postnatal day (P) 6 to P50. In this study, we correlate the boundaries of gene expression patterns with developing areal boundaries across a lifespan, in order to better understand the nature of gene-areal relationships from early postnatal life to adulthood.


Figures

Figure 1.
Figure 1.
Analysis of INC formation at P6, P10, P15, and P20; 100-μm coronal sections presented in rostral to caudal series (A1–X1, A2–X2) of brain hemispheres following DiI or DiA crystal placement, oriented with dorsal up and lateral to the right. For all ages, Brain 1 had DPLs in motor (A1, G1, M1, S1) and auditory cortex (D1, K1, Q1, W1); Brain 2 had DPLs in somatosensory (C2, H2, N2, T2) and visual cortex (E2, K2, R2, X2). From P6 through P20, features of sensory areas (such as lamina and barrel fields) become apparent, but primary areas, as labeled by INCs, remain segregated. Asterisks in sections indicate dye placement locations DPLs. The F1 arrow indicates MGN labeling. Small arrow in D2 and large arrows in J2 and V2 indicate the visual/somatosensory boundary. Large arrows in D2, H2, O2, and U2 and stars indicate the barrel field. m, motor; s, somatosensory; a, auditory; and v, visual areas. Scale bar = 500 μm.
Figure 2.
Figure 2.
Analysis of INC formation at P30, P40, and P50; 100-μm coronal sections presented in rostral to caudal series (A1–R1, A2–R2) of brain hemispheres following DiI or DiA crystal placement. Conventions and abbreviations as in previous. For all ages, Brain 1 had DPLs in motor (A1, G1, N1) and auditory cortex (E1, K1, R1). Brain 2 had DPLs in somatosensory (B2, I2, N2) and visual cortex (F2, L2, R2). Despite the closing of sensory critical periods, the sensory and motor INCs remain substantially unchanged from P30 to P50. Arrows in D2, K2, and P2 indicate the visual/somatosensory boundary. Arrows in C2, J2, and O2 indicate the barrel field. Scale bar = 500 μm.
Figure 3.
Figure 3.
Reconstruction of areal boundaries through analysis of INCs. All panels represent a lateral view of one hemisphere. Panels (AG): DPLs and organization of retrogradely labeled cells (black or gray patches = DPL plus dye spread; gray filled circles = retrogradely labeled cells in visual cortex; gray plus signs = retrogradely labeled cells in motor cortex; black filled circles: retrogradely labeled cells in somatosensory cortex; black plus signs = retrogradely labeled cells in auditory cortex; thick black line = hemisphere outline). Panels (A'–G'): lateral view reconstructions of areal boundaries as determined by INC analyses (gray and black lines = cortical areas as labeled; m, motor cortex; m + s, sensory–motor amalgam; s, somatosensory cortex; a, auditory cortex; v, visual cortex). Stars denote location of barrel field. Oriented medial (M) up and rostral (R) to the left. Scale bar = 1 mm.
Figure 4.
Figure 4.
Analysis of neocortical gene expression of COUP-TFI; 100-μm rostral to caudal coronal series (A to G1–4) and sagittal (A to G5–6) sections of P6 (A1–6), P10 (B1–6), P15 (C1–6), P20 (D1–6), P30 (E1–6), P40 (F1–6), or P50 (G1–6) brain hemispheres after in situ hybridization with a probe for COUP-TFI, oriented with dorsal up (all sections) and medial (A to G1–4) or rostral (A to G5–6) to the left. Panels (A7–G7) show lateral view reconstructions of gene expression gradients or gene maps within one hemisphere (gray shaded areas) coregistered with areal reconstructions at each age. Other conventions as in previous. At P6, COUP-TFI expression is seen throughout the cortex with the strongest levels caudo/laterally (arrow in A4), and differences in laminar distribution of transcripts are observed at different rostral/caudal locations. Expression in superficial layers becomes more homogenous at later ages, and intensity of expression decreases. Arrows in A4, B4, C4, D4, and E4 highlight the expression gradient, the arrow in A6 highlights rostromedial expression and arrows in A2, B2, B5, C2, C5, D2, D5, and E3 indicate the barrel field. Scale bar = 1 mm.
Figure 5.
Figure 5.
Analysis of neocortical gene expression of Id2; 100-μm coronal (A to G1–4) or sagittal (A to G5–6) sections and gene maps (A7–G7) of P6–P50 brain hemispheres after in situ hybridization with a probe for Id2, with conventions as in previous. Expression of Id2 is seen throughout the neocortex at P6, with most layers displaying distinct differences along the rostral/caudal and medial/lateral axes. At later ages, the pattern of expression remains similar. While intensity of expression decreases with time, medial cortex exhibits comparatively more robust expression levels. Arrows in A4, B3–4, B6, C2–4, D2–4, and E3 highlight medial/caudomedial expression; A3, B5, C6, D5, and E2 arrows indicate the barrel field; A2 arrow highlights the expression gradient. Scale bar = 1 mm.
Figure 6.
Figure 6.
Analysis of neocortical gene expression of Lhx2; 100-μm coronal (A to G1–4) or sagittal (A to G5–6) sections and gene maps (A7–G7) of P6–P50 brain hemispheres after in situ hybridization with a probe for Lhx2, with conventions as in previous. At P6, Lhx2 transcripts are found primarily in superficial layers along the entire rostral/caudal extent of the cortex, with lower levels seen in the barrels and caudally. Intensity of expression decreases by the second week but patterns remain largely unchanged. Arrow in A2 highlights rostrolateral expression; arrow in A4 indicates the auditory area; arrows in A3, A5–6, and B6 indicate the barrel field; arrow in B3 highlights a region of medial expression; arrows in B4, C6, and D6 highlight caudal expression. Scale bar = 1 mm.
Figure 7.
Figure 7.
Analysis of neocortical gene expression of RZRß; 100-μm coronal (A to G1–4) or sagittal (A to G5–6) sections and gene maps (A7–G7) of P6–P50 brain hemispheres after in situ hybridization with a probe for RZRß, with conventions as in previous. RZRβ expression at P6 is observed in layers IV and V with stronger expression in primary areas. This pattern remains at later ages but the intensity of expression shows a moderate decrease. A4, B3 lateral, B4, C3–4, and E4 arrows indicate primary sensory areas; A3, A5, B2, B3 medial, C2, C5, D2–3, D5, E2–3, F2, and G2 arrows indicate the barrel field. Scale bar = 1 mm.
Figure 8.
Figure 8.
Analysis of neocortical gene expression of Cad8; 100-μm coronal (A to G1–4) or sagittal (A to G5–6) sections and gene maps (A7–G7) of P6–P50 brain hemispheres after in situ hybridization with a probe for Cad8, with conventions as in previous. At P6, Cad8 expression is strongest at both poles of the neocortex, with intervening regions displaying heterogeneous distribution of transcripts among layers. At later ages, exclusion of expression from the barrels becomes pronounced, and expression decreases in intensity with most noticeable losses laterally. A2, A6 rostral, B5 rostral, C5 rostral, D3, and E3 arrows indicate the barrel field; A6 caudal arrow indicates expression in the visual area; A1, B2, C1–2, D1–2, and E2 arrows indicate expression in the motor and somatosensory areas; B5 caudal, C5 caudal, D5–6, and E5 arrows highlight expression in caudal/lateral areas. Scale bar = 1 mm.
Figure 9.
Figure 9.
Analysis of neocortical gene expression of EphA7; 100-μm coronal (A to G1–4) or sagittal (A to G5–6) sections and gene maps (A7–G7) of P6–P50 brain hemispheres after in situ hybridization with a probe for EphA7, with conventions as in previous. EphA7 expression at P6 is confined to mostly superficial layers and is strongest medially and caudolaterally. At subsequent ages, the intensity of expression decreases nonuniformly, with medial locations exhibiting a slower decline. A2, A4 medial, B3 medial, C3 medial, and D2 arrows highlight medial expression; B3 ventral, C3 ventral, and D3 arrows indicate the hippocampus; A4 lateral arrow highlights lateral expression. Scale bar = 1 mm.
Figure 10.
Figure 10.
Analysis of neocortical gene expression of EphrinA5; 100-μm coronal (A to G1–4) or sagittal (A to G5–6) sections and gene maps (A7–G7) of P6–P50 brain hemispheres after in situ hybridization with a probe for EphrinA5, with conventions as in previous. At P6, EphrinA5 is expressed throughout the cortex, excluding the rostral pole, with strongest levels in somatosensory cortex and caudolaterally. This pattern remains unchanged at later ages but intensity of expression decreases. A2, B2, B6, C2, C6, and D2 arrows highlight medial regions of expression; A4, B3, C4, and D4 arrows highlight lateral regions of expression; A3, D3, D5, and E2–3 arrows indicate the barrel field. Scale bar = 1 mm.
Figure 11.
Figure 11.
Analysis of neocortical gene expression in the barrel field of somatosensory cortex; 100-μm sagittal sections (A to D1–4) sections of brain hemispheres after in situ RNA hybridization with probes for COUP-TFI (A1–D1), Id2 (A2–D2), RZRβ (A3–D3), and Cad8 (A4–D4), oriented with dorsal up and rostral to the left. The ages examined were as follows: P6 (A1–4), P10 (B1–4), P20 (C1–4), and P40 (D1–4). COUP-TFI and RZRβ exhibit robust expression in the barrels and surrounding regions of layer IV and V. Id2 and Cad8 display limited expression in the barrels but expression in nearby areas aids in barrel identification. A2 arrow indicates a lack of Id2 expression in layer IV; B1 arrow indicates barrel hollow; B3 right, C2 and D1 arrows indicate barrel septa; all other arrows indicate one complete barrel. Scale bar = 100 μm.
Figure 12.
Figure 12.
INC and gene expression relationships revealed by a novel, flattened reconstruction approach. Analysis of the relationships between INCs and neocortical gene expression was conducted through design of flattened reconstructions of INCs (AG), and gene expression patterns (A'–G') and coregistrations of the 2 data sets (A''–G''), where areal boundaries are shaded. In all 3 columns, similar ages are presented from left to right as follows: AA'', P6; BB'', P10; CC'', P15; DD'', P20; EE'', P30; FF'', P40; and GG'', P50. (AG) Colored patches = DPL plus dye spread; red filled circles = retrogradely labeled cells in visual cortex; green filled circles = retrogradely labeled cells in motor cortex; blue filled circles: retrogradely labeled cells in somatosensory cortex; yellow filled circles = retrogradely labeled cells in auditory cortex; thick black line = hemisphere outline. In (A'–G') and (A''–G''), the flattened, reconstructed expression of each gene is represented by a colored line as follows: COUP-TFI, red; Id2, orange; Lhx2, burgundy; RZRβ, blue; Cad8, green; EphA7, gray; EphrinA5, purple. The pastel shaded regions in (A''–G'') denote areal boundaries of sensory and motor areas, determined from the patterns of INCs, as labeled (m, motor cortex; m + s, sensory–motor amalgam; s, somatosensory cortex; a, auditory cortex; v, visual cortex). Stars denote location of barrel field. Oriented medial (M) up and rostral (R) to the left. Scale bar = 1 mm.

Similar articles

Cited by

References

    1. Agmon A, Yang LT, Jones EG, O'Dowd DK. Topological precision in the thalamic projection to neonatal mouse barrel cortex. J Neurosci. 1995;15:549–561. - PMC - PubMed
    1. Agmon A, Yang LT, O'Dowd DK, Jones EG. Organized growth of thalamocortical axons from the deep tier of terminations into layer IV of developing mouse barrel cortex. J Neurosci. 1993;13:5365–5382. - PMC - PubMed
    1. Armentano M, Chou SJ, Tomassy GS, Leingärtner A, O'Leary DD, Studer M. COUP-TFI regulates the balance of cortical patterning between frontal/motor and sensory areas. Nat Neurosci. 2007;10:1277–1286. - PubMed
    1. Bayer SA, Altman J. Neocortical development. New York: Raven; 1991.
    1. Berardi N, Pizzorusso T, Maffei L. Critical periods during sensory development. Curr Opin Neurobiol. 2000;10:138–145. - PubMed

Publication types

MeSH terms