. 2010 Dec;120(12):4289-302.
doi: 10.1172/JCI42015. Epub 2010 Nov 8.

Deregulation of the Pit-1 transcription factor in human breast cancer cells promotes tumor growth and metastasis

Affiliations

Deregulation of the Pit-1 transcription factor in human breast cancer cells promotes tumor growth and metastasis

Isabel Ben-Batalla et al. J Clin Invest. 2010 Dec.

Abstract

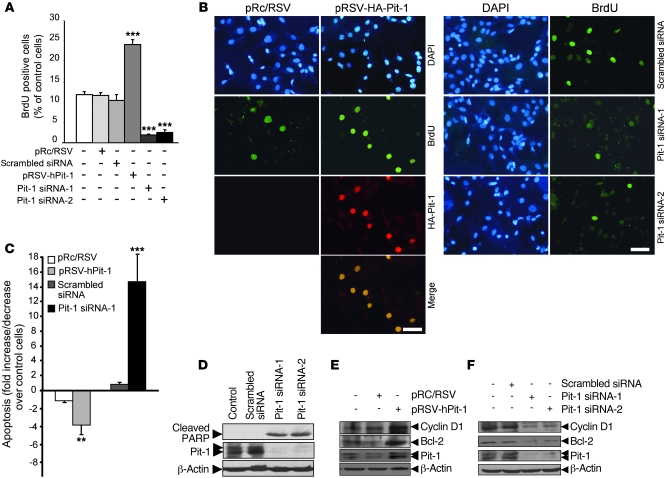
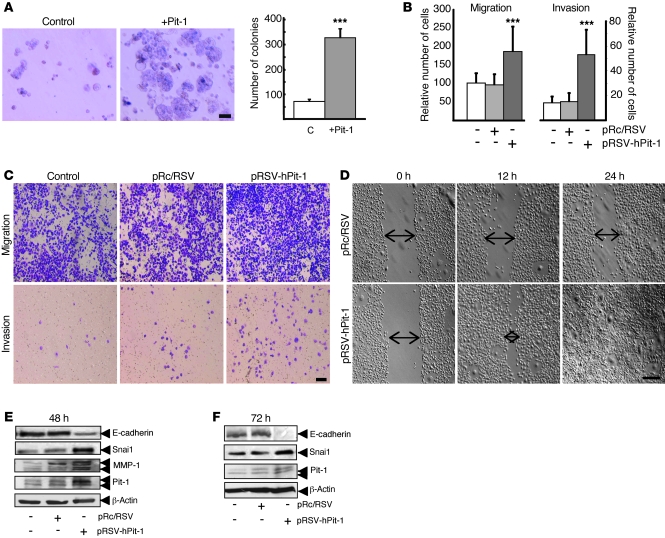
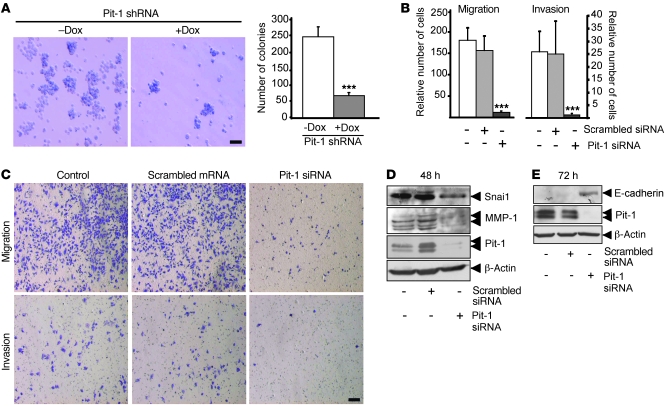
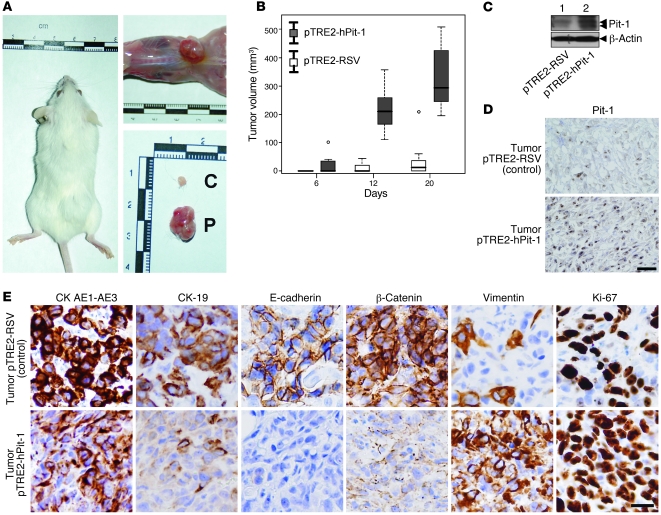
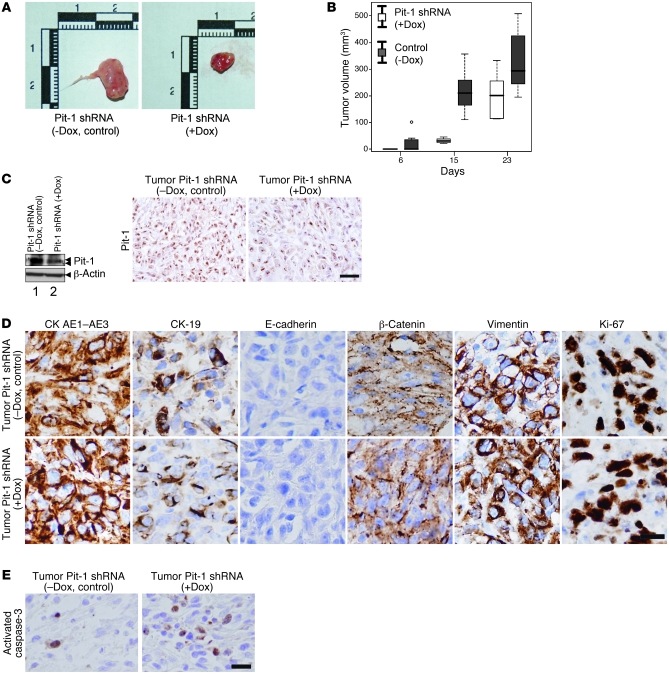
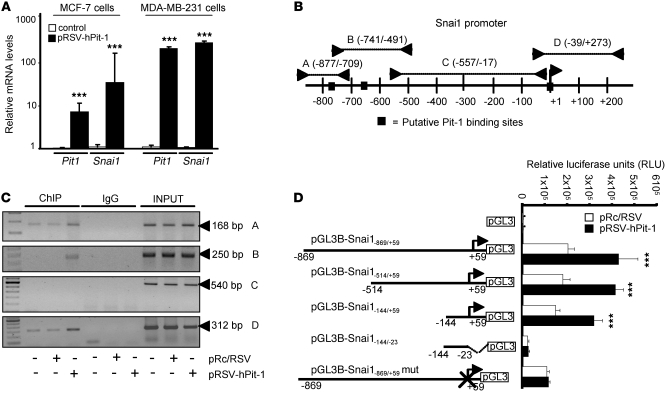
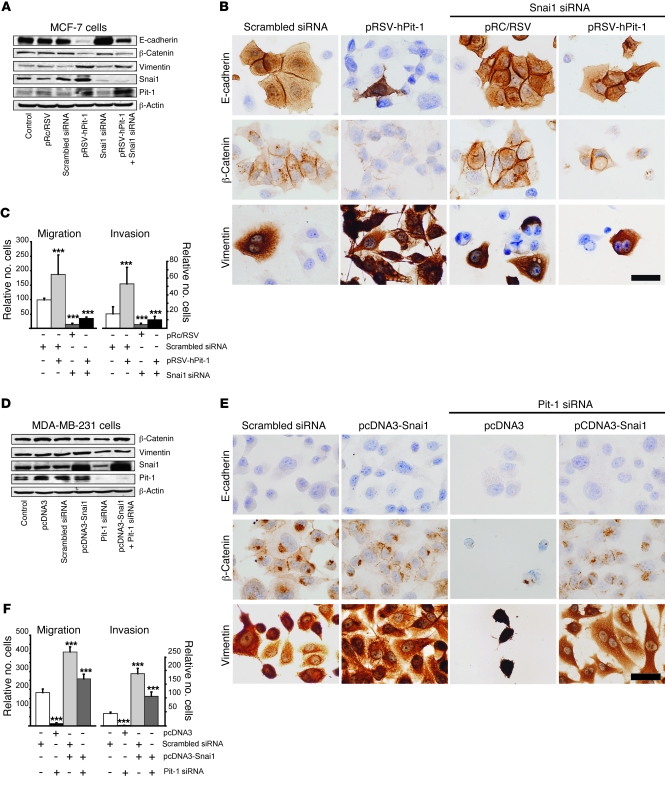
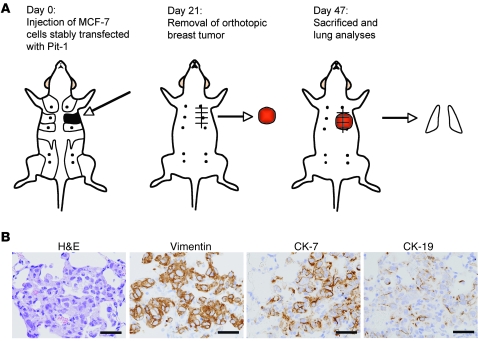
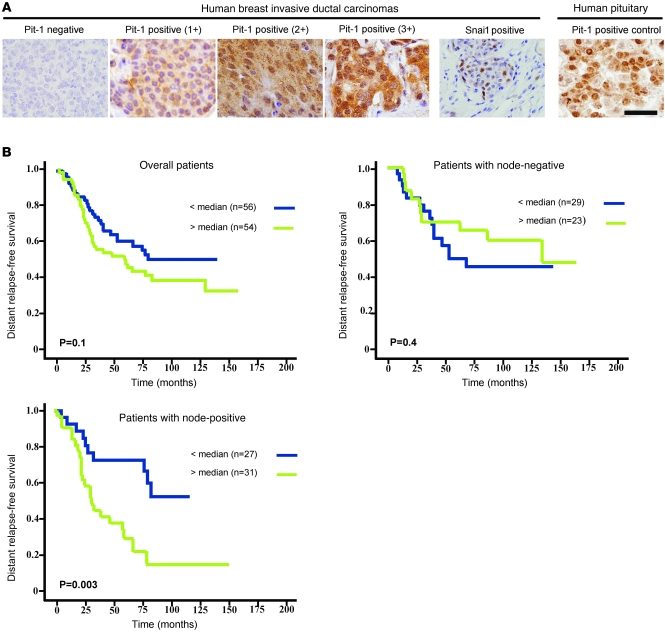
The Pit-1 transcription factor (also know as POU1F1) plays a critical role in cell differentiation during organogenesis of the anterior pituitary in mammals and is a transcriptional activator for pituitary gene transcription. Increased expression of Pit-1 has been reported in human tumorigenic breast cells. Here, we found that Pit-1 overexpression or knockdown in human breast cancer cell lines induced profound phenotypic changes in the expression of proteins involved in cell proliferation, apoptosis, and invasion. Some of these protumorigenic effects of Pit-1 were mediated by upregulation of Snai1, an inductor of the epithelial-mesenchymal transition. In immunodeficient mice, Pit-1 overexpression induced tumoral growth and promoted metastasis in lung. In patients with invasive ductal carcinoma of the breast and node-positive tumor, high expression of Pit-1 was significantly correlated with Snai1 positivity. Notably, in these patients elevated expression of Pit-1 was significantly and independently associated with the occurrence of distant metastasis. These findings suggest that Pit-1 could help to make a more accurate prognosis in patients with node-positive breast cancer and may represent a new therapeutic target.


Figures

Figure 1
Figure 1. Pit-1 regulates proliferation and cell death in the MCF-7 human breast adenocarcinoma cell line.
(A) Overexpression of Pit-1 in the MCF-7 cell line for 48 hours increases BrdU uptake, while knockdown of Pit-1 has the opposite effect. (B) Representative example of incorporation of BrdU in MCF-7 cells after overexpression or knockdown of Pit-1. For overexpression, the cells were immunostained with an anti-hemagglutinin antibody to localize Pit-1 expression. Scale bar: 50 μm. (C) Flow cytometric analysis of apoptosis in MCF-7 cells 48 hours after Pit-1 overexpression or knockdown. (D) Western blot shows cleavage of poly (ADP-ribose) polymerase (PARP) (89 kDa), which is used as an apoptosis indicator, 48 hours after transfecting MCF-7 cells with Pit-1 siRNA-1 and siRNA-2. (E and F) Western blot of cyclin D1, Bcl-2, Pit-1, and β-actin in MCF-7 cells 48 hours (E) after Pit-1 overexpression or (F) after Pit-1 knockdown. (DF) The major 31- and 33-kDa immunoreactive bands corresponding to Pit-1 are indicated with double arrowheads. Values are reported as mean ± SD. **P < 0.01, ***P < 0.001.
Figure 2
Figure 2. Pit-1 induces invasive and malignant features in the noninvasive MCF-7 human breast carcinoma cell line.
(A) Overexpression of Pit-1 (pTRE2-hPit-1) in MCF-7 cells after 8 days induces a significant (***P < 0.001) increase in cell colony formation in soft agar, with respect to that of control cells. C, control cells. Scale bar: 75 μm. (B and C) Cell motility through uncoated filters (migration) and through Matrigel-coated filters (invasion) at 48 hours in the control cells, pRc/RSV–transfected MCF-7 cells, and pRSV-hPit-1–transfected MCF-7 cells (***P < 0.001 versus control cells). Numbers represent mean ± SD. (C) Representative example of B. Cells were stained with crystal violet, visualized with microscopy, and counted. Scale bar: 100 μm. (D) Wound healing assay. The wounded areas (space indicated by arrows) were examined with microscopy at the indicated times. Scale bar: 250 μm. (E) Protein extracts of MCF-7 cells 48 hours after transfection with the empty vector (pRc/RSV) or with pRSV-hPit-1–expressing vector were prepared and tested using Western blotting for E-cadherin, Snai1, MMP-1, Pit-1, and β-actin. (F) Western blot assay showing a suppression of E-cadherin expression 72 hours after Pit-1 overexpression in MCF-7 cells. (E and F) Double arrowheads in the MMP-1 immunoblot indicate proenzyme form (top arrow) and active form (bottom arrow). Double arrowheads in Pit-1 immunoblots indicate 33-kDa and 31-kDa immunoreactive bands.
Figure 3
Figure 3. Knockdown of endogenous Pit-1 in the invasive MDA-MB-231 breast carcinoma cell line reduces malignant traits.
(A) Knockdown of Pit-1 in MDA-MB-231 cells (treated with doxycycline [+Dox]) significantly (***P < 0.001) reduces the number of colonies in soft agar at 12 day, as compared with that of controls (not treated with doxycycline [–Dox]). Scale bar: 75 μm. (B and C) Knockdown of Pit-1 for 48 hours in MDA-MB-231 cells significantly inhibits cell motility through uncoated filters (migration) and through Matrigel-coated filters (invasion). Error bars represent SD. ***P < 0.001 versus controls. Cells were stained with crystal violet, visualized with microscopy, and counted. Scale bar: 100 μm. (D) Western blot in MDA-MB-231 cells indicating a decrease of Snai1 and MMP-1 expression 48 hours after endogenous Pit-1 suppression. (E) A band corresponding to the E-cadherin size is readily visible using Western blot 72 hours after blocking endogenous Pit-1 in MDA-MB-231 cells. (D and E) Double arrowheads in the MMP-1 immunoblot indicate proenzyme form (top arrow) and active form (bottom arrow). Double arrowheads in Pit-1 immunoblots indicate 33-kDa and 31-kDa immunoreactive bands.
Figure 4
Figure 4. Subcutaneous injection of Pit-1–overexpressing MCF-7 cells in SCID mice increases tumor growth and induces EMT.
(A) Seven SCID mice were subcutaneously injected with control MCF-7 cells (left flank) or MCF-7 cells stably transfected with Pit-1 expression vector (right flank). C, control cells; P, Pit-1–overexpressing MCF-7 cells. (B) Box plot of tumor growth in SCID mice, as described in A. The bottom and the top of the boxes represent the first and third quartiles (i.e., the 25th and 75th percentile, respectively), and the bands near the middle of each box represent the 50th percentile (the median). The ends of the whiskers represent the lowest and the highest values still within 1.5 interquartile range of the lower and upper quartiles, respectively. (C and D) Western blot and immunohistochemistry of Pit-1 in tumors of SCID mice injected with MCF-7 control cells stably transfected either with the pTRE2-hPit-1 expression vector or the control vector (pTRE2) at day 20. Double arrowheads in the Pit-1 immunoblot indicate 33-kDa and 31-kDa immunoreactive bands. Scale bar: 40 μm. (E) Immunohistochemistry analysis of epithelial (CK AE1-AE3, CK-19, E-cadherin, and β-catenin), mesenchymal (vimentin), and proliferation (Ki-67) markers in tumors of SCID mice injected with control or Pit-1–overexpressing MCF-7 cells. Scale bar: 25 μm.
Figure 5
Figure 5. Knockdown of Pit-1 levels in MDA-MB-231 cells reduces tumoral growth when injected into SCID mice.
(A) Six SCID mice were subcutaneously injected in the left and right flanks with MDA-MB-231 cells stably transfected with the pSingle-tTS-Pit-1shRNA doxycycline-induced vector and treated (+Dox) or not treated (–Dox, control) with doxycycline to induce Pit-1shRNA. A sample tumor from each group is shown. (B) Box plot of tumor growth in SCID mice, as described in A. The box plot is defined as in Figure 4B. (C) Western blots and immunohistochemical detection of Pit-1 in tumors of SCID mice, as described in A. Double arrowheads in the Pit-1 immunoblot indicate 33-kDa and 31-kDa immunoreactive bands. Scale bar: 40 μm. (D) Immunohistochemical detection of epithelial, mesenchymal, and proliferation markers, as described in Figure 4E. Scale bar: 25 μm. (E) Immunohistochemical detection of activated caspase-3 in tumors of SCID mice, as described in A. Scale bar: 40 μm.
Figure 6
Figure 6. Pit-1 transcriptionally regulates Snai1 expression.
(A) Relative expression of the mRNAs encoding Pit-1 and Snai1 in MCF-7 and MDA-MB-231 cells before and after Pit-1 overexpression, as determined by real-time PCR. Rn18s mRNA was used to normalize the variability in template loading. Values are expressed as mean ± SD. ***P < 0.001 versus controls. (B) The diagram shows the Snai1 promoter with the putative Pit-1 binding sites (identified by filled squares) and the regions amplified using specific primers (see Supplemental Methods) in the ChIP assay (identified by lines with arrowheads as A, B, C, and D). The initiation transcription site is indicated by a single arrowhead at position +1. (C) Soluble chromatin obtained from control, pRc/RSV–transfected MCF-7 cells, and pRSV-hPit-1–transfected MCF-7 cells was immunoprecipitated with anti–Pit-1 antibody or control IgG. The immunoprecipitated DNA was amplified by PCR using primers (see Supplemental Methods) A, B, C, and D, as shown in B. (D) Deletion analysis and selective mutations at position –5/+4 bp from the start transcription site identified a Pit-1–responsive region in the human Snai1 promoter. MCF-7 cells were transfected with several Snai1 promoter fragments fused to pGL3Basic (pGL3B) vector. Normalized relative luciferase units (RLU) were calculated as the ratio of luciferase activity in Pit-1–overexpressing cells to the activity in the corresponding control cells. *** P < 0.001 versus controls. Data are expressed as mean ± SD.
Figure 7
Figure 7. Pit-1, independently and through Snai1, modifies expression of proteins involved in EMT and cell motility.
(A) Western blots of E-cadherin, β-catenin, vimentin, Snai1, and Pit-1 in control MCF-7 cells 48 hours after transfection of pRSV-hPit-1 and/or Snai1 siRNA. (B) Immunohistochemistry of E-cadherin, β-catenin, and vimentin, as indicated in A. Scale bar: 25 μm. (C) Migration and invasion assay in MCF-7 control cells and cells transfected as described in A. (D) Western blots of β-catenin, vimentin, Snai1, and Pit-1, and β-actin for control MDA-MB-231 cells, as well as for cells 48 hours after (i) Snai1 overexpression, (ii) Pit-1 knockdown, and (iii) both Snai1 overexpression and Pit-1 knockdown. (E) Immunohistochemistry of E-cadherin, β-catenin, and vimentin, as described in D. Scale bar: 25 μm. (F) Migration and invasion assay in MDA-MB-231 control cells and cells transfected as described in D. Values are expressed as mean ± SD. ***P < 0.001 versus controls.
Figure 8
Figure 8. Orthotopic injection of Pit-1–overexpressing MCF-7 cells in SCID mice induces metastasis in lung.
(A) Schematic representation of experimental induction of metastasis. At day 0, eleven SCID mice were injected with MCF-7 cells (controls) and twelve SCID mice were injected with MCF-7 cells stably transfected with Pit-1–overexpressing vector into the second mammary fad pat. At day 21, animals were anesthetized and breast tumors were resected. On day 47, mice were sacrificed and lungs were removed for analysis. Nine out of twelve SCID mice injected with MCF-7 cells overexpressing Pit-1 showed micrometastasis in lung. Two micrometastasis were observed in mice (n = 11) injected with control MCF-7 cells. (B) Representative example of micrometastasis in lung. H&E staining and immunopositivity for vimentin, CK-7, and CK-19. Scale bar: 40 μm.
Figure 9
Figure 9. High expression of Pit-1 in human ductal invasive carcinomas of the breast correlates with occurrence of distant metastasis.
(A) Representative set of negative and positive (1+, 2+, and 3+) Pit-1 and Snai1 immunodetections in human breast invasive ductal carcinomas. Pit-1 immunopositivity in human pituitary gland was used as positive control. Scale bar: 50 μm. (B) Kaplan-Meier survival curves as a function of the immunostaining expression of Pit-1 in the overall group of patients (n = 110), in the subgroup with node-negative breast cancer (n = 52), and in the subgroup with node-positive breast cancer (n = 58). The median of the immunostaining score values in the overall group of patients (score 35.4) was chosen as the cut-off point for both node-negative and node-positive patient subgroups.

Similar articles

Cited by

References

    1. Nguyen DX, Bos PD, Massague J. Metastasis: from dissemination to organ-specific colonization. Nat Rev Cancer. 2009;9(4):274–284. doi: 10.1038/nrc2622. - DOI - PubMed
    1. Thiery JP. Epithelial-mesenchymal transitions in tumour progression. Nat Rev Cancer. 2002;2(6):442–454. - PubMed
    1. Polyak K, Weinberg RA. Transitions between epithelial and mesenchymal states: acquisition of malignant and stem cell traits. Nat Rev Cancer. 2009;9(4):265–273. doi: 10.1038/nrc2620. - DOI - PubMed
    1. Yang J, et al. Twist, a master regulator of morphogenesis, plays an essential role in tumor metastasis. Cell. 2004;117(7):927–939. doi: 10.1016/j.cell.2004.06.006. - DOI - PubMed
    1. Barrallo-Gimeno A, Nieto MA. The Snail genes as inducers of cell movement and survival: implications in development and cancer. Development. 2005;132(14):3151–3161. doi: 10.1242/dev.01907. - DOI - PubMed

Publication types

MeSH terms

Substances