. 2010 Dec;120(12):4236-50.
doi: 10.1172/JCI41196. Epub 2010 Nov 8.

α-1 Antitrypsin regulates human neutrophil chemotaxis induced by soluble immune complexes and IL-8

Affiliations

α-1 Antitrypsin regulates human neutrophil chemotaxis induced by soluble immune complexes and IL-8

David A Bergin et al. J Clin Invest. 2010 Dec.

Abstract

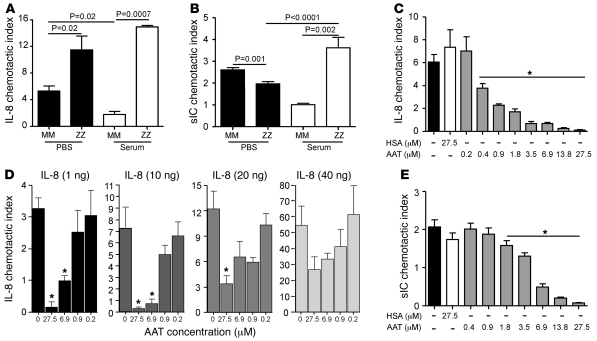
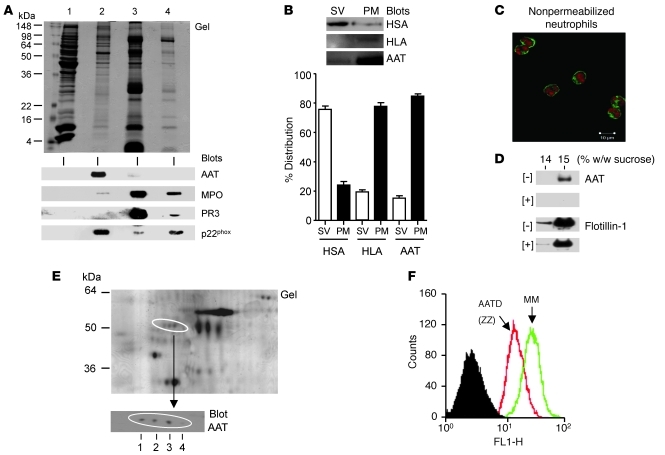
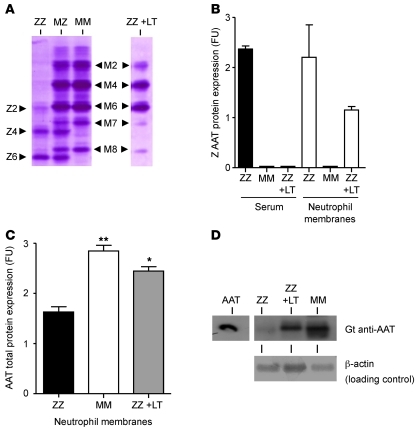
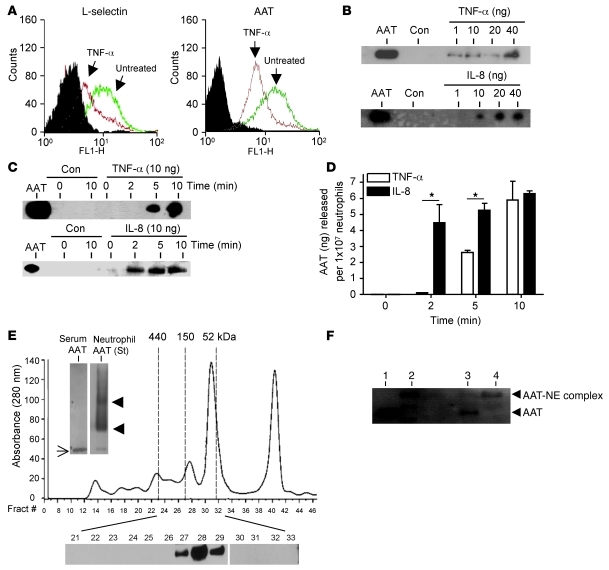
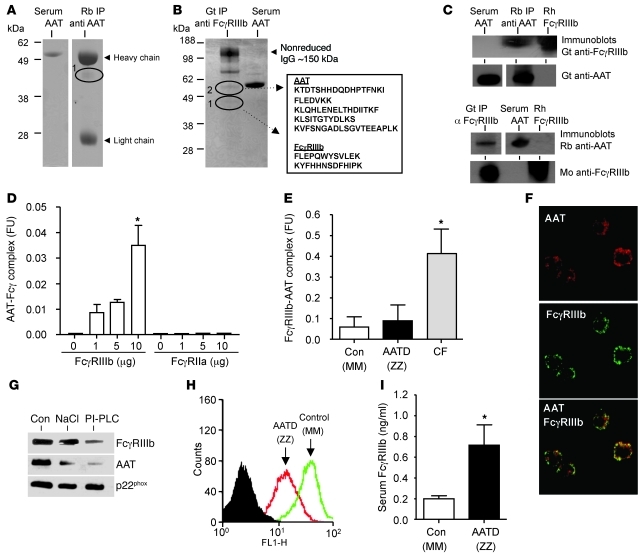
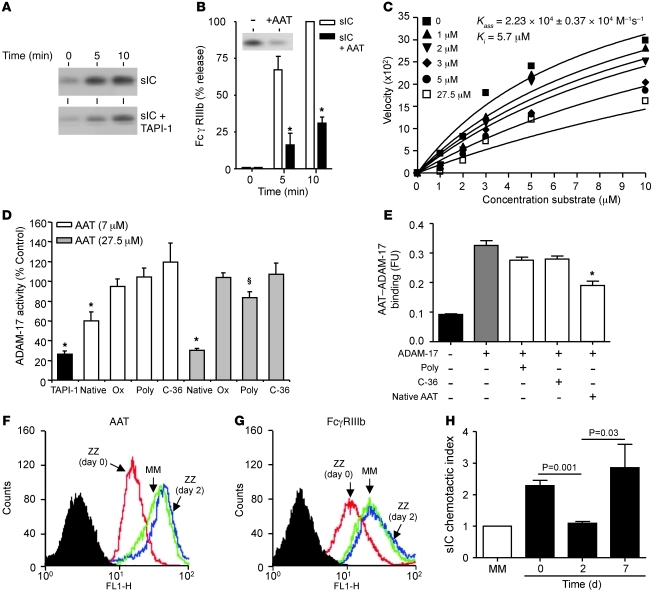
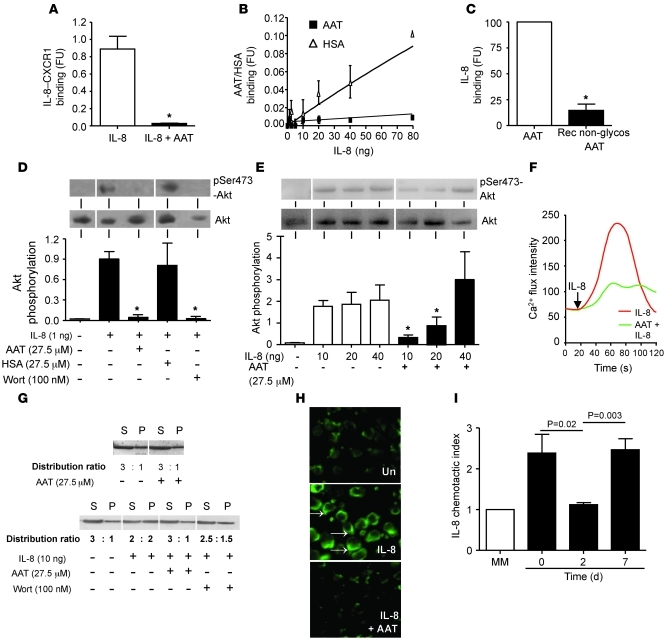
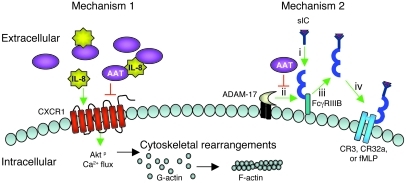
Hereditary deficiency of the protein α-1 antitrypsin (AAT) causes a chronic lung disease in humans that is characterized by excessive mobilization of neutrophils into the lung. However, the reason for the increased neutrophil burden has not been fully elucidated. In this study we have demonstrated using human neutrophils that serum AAT coordinates both CXCR1- and soluble immune complex (sIC) receptor-mediated chemotaxis by divergent pathways. We demonstrated that glycosylated AAT can bind to IL-8 (a ligand for CXCR1) and that AAT-IL-8 complex formation prevented IL-8 interaction with CXCR1. Second, AAT modulated neutrophil chemotaxis in response to sIC by controlling membrane expression of the glycosylphosphatidylinositol-anchored (GPI-anchored) Fc receptor FcγRIIIb. This process was mediated through inhibition of ADAM-17 enzymatic activity. Neutrophils isolated from clinically stable AAT-deficient patients were characterized by low membrane expression of FcγRIIIb and increased chemotaxis in response to IL-8 and sIC. Treatment of AAT-deficient individuals with AAT augmentation therapy resulted in increased AAT binding to IL-8, increased AAT binding to the neutrophil membrane, decreased FcγRIIIb release from the neutrophil membrane, and normalization of chemotaxis. These results provide new insight into the mechanism underlying the effect of AAT augmentation therapy in the pulmonary disease associated with AAT deficiency.


Figures

Figure 1
Figure 1. Chemotactic analysis of neutrophils in response to AAT.
(A) Increased mean chemotactic index of ZZ-AATD neutrophils (n = 6) compared with healthy control (MM) cells (n = 6) in response to IL-8 (10 ng/2 × 107 cells). Assays were preformed in PBS or serum (50% v/v) from respective ZZ or MM individuals. (B) Decreased mean chemotactic index of ZZ-AATD neutrophils (n = 6) in PBS in response to sIC (10% v/v), yet increased mean chemotactic index of ZZ-AATD neutrophils in serum (50% v/v) compared with healthy control cells (n = 6). (C) An increase in chemotactic inhibition efficiency of increasing concentration of AAT (0.2–27.5 μM). Black bar, positive IL-8 (10 ng) control; white bar, negative HSA (27.5 μM) control. *P < 0.05 versus IL-8 control. (D) Neutrophil chemotaxis in a linear gradient of IL-8 (1, 10, 20, or 40 ng) or complex gradient in the presence of inhibitory AAT (27.5, 6.9, 0.9, 0.2 μM) (*P < 0.05 compared with AAT-untreated cells). (E) Increased chemotactic inhibition efficiency of increasing concentrations of AAT (0.4–27.5 μM). Black bar, positive sIC (10% v/v) control; white bar, negative HSA (27.5 μM) control. *P < 0.05 versus sIC control. Experiments illustrated in AE were performed in triplicate on 3 consecutive days, and for comparative analysis the PBS control was set at a chemotactic index of 1. Each measurement is the mean ± SEM.
Figure 2
Figure 2. Localization of AAT in peripheral blood neutrophils.
(A) Coomassie blue–stained gel of normal MM neutrophils subjected to subcellular fractionation yielding a cytosol fraction (lane 1), combined secretory vesicle/plasma membrane fraction (lane 2), and primary and secondary granule fraction (lanes 3 and 4, respectively). Western blotting employed antibodies to MPO and PR3 as markers of primary granules and antibodies against p22phox of cytochrome b558 as a marker of secondary granules and combined secretory vesicle/membrane fractions. AAT was localized to the secretory vesicle/membrane fraction at the interface between the 17.5/35% (w/w) sucrose. (B) By Percoll gradient fractionation, approximately 83% of AAT was localized to the plasma membrane (PM) compared with secretory vesicles (SV). As controls, HLA served as a marker of PM and HSA as a marker of SV. (C) By confocal microscopy, the distribution of AAT in non-permeabilized MM neutrophils was predominantly localized to the membrane margin of the cell. Cell nuclei are stained red. Scale bar: 10 μm. (D) Detection of AAT and flotillin-1 in the low-density lipid raft fractions (15% w/w sucrose) of human MM neutrophil lysates: untreated (–) or treated with MβCD (10 mM) (+). Immunoblots were probed with polyclonal anti-AAT and monoclonal anti–flotillin-1. (E) Coomassie blue–stained 2D SDS-PAGE gel of isolated MM neutrophil membrane lipid rafts (top panel). A Western blot probed with polyclonal anti-AAT revealed 4 associated AAT isoforms (lower panel). (F) Flow cytometry analysis of membrane-bound AAT in isolated resting MM (green) and ZZ-AATD (red) neutrophils. The level of AAT was found to be significantly higher on resting MM neutrophils. The isotype control antibody is illustrated in black (filled). Experiments in A, D, and E are each representative gels and blots of 3 separate experiments. Results in B represent experiments performed in triplicate on 3 consecutive days, and each bar is the mean ± SEM. Confocal analysis in C and FACS analysis in F are one illustrative result from 3 independent experiments.
Figure 3
Figure 3. Serum- and neutrophil-derived AAT binds the neutrophil membrane.
(A) Isoelectrofocusing patterns for ZZ, heterozygous MZ, or MM serum compared with serum of a ZZ-AATD individual after liver transplantation (ZZ+LT). The isoform numbers for the M and Z variants are indicated. The AAT pattern of the ZZ+LT sample was of the M variant. (B) ELISA for detection of the Z-form of AAT in serum and neutrophil membranes. Results in arbitrary fluorescence units (FU) indicate positive detection of Z-AAT in serum and neutrophil membranes of a ZZ-AATD patient but only in neutrophil membranes after LT (P = 0.2 between ZZ and ZZ+LT neutrophil membranes). An ELISA for detection of total AAT (M and Z variants) (C) and Western blots probed with goat (Gt) polyclonal anti-AAT (D) revealed significantly higher levels of total AAT on ZZ-AATD neutrophil membranes after liver transplantation (ZZ+LT) compared with a non-transplant ZZ-AATD patient (*P = 0.01, **P = 0.001). Results represent experiments performed in triplicate, and data in B and C are the mean ± SEM.
Figure 4
Figure 4. Release of biologically active AAT from TNF-α– or IL-8–treated MM neutrophils.
(A) Membrane expression of L-selectin or AAT on neutrophils at baseline (green) or in response to TNF-α (red). (B) Western blot showing extracellular released AAT (52 kDa) following treatment with TNF-α or IL-8 in a dose- (B) and time-dependent manner (C). Serum AAT (52 kDa) was loaded as a positive antibody control, and untreated cells are in lanes labeled as control (Con). (D) Time course analysis of the release of AAT (*P < 0.05). (E) Gel filtration chromatography of neutrophil-released AAT. The start material (St) was released AAT from IL-8–treated neutrophils (10 ng). Inset: Western blot analysis illustrating altered migration of purified serum AAT (arrow) compared with neutrophil-released AAT (arrowheads). By Western blot analysis, fraction 28 contained neutrophil-released AAT and chromatographed at a molecular mass of 100–110 kDa. Fractions 30–33 were run on separate gels. (F) Formation of AAT-protease complexes. Samples were immunoblotted employing a rabbit anti-human AAT antibody. Lanes 1 and 3 show serum purified AAT and AAT released from neutrophils, respectively. Lanes 2 and 4 illustrate serum and neutrophil-released AAT incubated with NE. FACS analysis illustrated in A is a representative result of 3 independent experiments. B, C, and F are each representative Western blots of 3 separate experiments. Results in D represent experiments performed in triplicate. Each measurement is the mean ± SEM. FPLC analyses (E) were performed in triplicate on 2 consecutive days.
Figure 5
Figure 5. AAT binds FcγRIIIb on the neutrophil membrane.
(A) Immunoprecipitate (IP) employing rabbit (Rb) antibody to AAT. The AAT binding partner (labeled 1) was identified as FcγRIIIb (40–60 kDa). (B) Reciprocal immunoprecipitate with FcγRIIIb goat (Gt) antibody. Coimmunoprecipitated proteins were identified as FcγRIIIb (labeled 1; accession number AA128563) and as AAT (labeled 2; accession number CAJ15161). (C) Western blots of immunoprecipitate reactions were performed with goat antibody against AAT (top panel) and mouse (Mo) antibody against FcγRIIIb (bottom panel). Serum purified AAT and recombinant human (Rh) FcγRIIIb are included as positive controls. (D) Binding of Rh FcγRIIIb or Rh FcγRIIa to AAT (*P = 0.02 compared with control containing no FcγRIIIb). (E) FcγRIIIb-AAT complex in serum of CF (n = 4) individuals was significantly higher than that of normal MM (Con; n = 6) or AATD (n = 6) subjects (*P < 0.05, CF versus control or ZZ). (F) Colocalization (merged image in yellow) of rhodamine labeling for AAT and FITC for FcγRIIIb, at the membrane margin of cells (×64 magnification, ×4 zoom). (G) NaCl and PI-PLC treatment of neutrophil membranes. Immunoblots included untreated membranes (Con) and antibodies against p22phox. (H) Flow cytometry analysis of membrane-bound FcγRIIIb (mean fluorescence: MM, 41.93; ZZ, 15.44). The isotype control antibody is in black (filled). (I) Levels of FcγRIIIb in serum of ZZ-AATD individuals and MM controls (Con) (*P = 0.01). In AC and G, images are representative results from 1 of 3 separate experiments. Lanes in A and C were run on the same gel but were noncontiguous. D, E, H, and I represent results performed in triplicate. Images in F are representative results of 2 independent experiments.
Figure 6
Figure 6. AAT prevents neutrophil chemotaxis in response to sIC through inhibition of ADAM-17 activity.
(A) Western blots showing time course of sIC-induced release of FcγRIIIb from MM neutrophils with or without TAPI-1 (10 mM). (B) Quantification of FcγRIIIb release from MM neutrophils treated with sIC (10% v/v) with or without AAT (27.5 mM) (*P < 0.05). Inset: Western blot illustrating FcγRIIIb release at the 10-minute time point. (C) Competitive inhibition of ADAM-17 by AAT. (D) The effect of oxidation (Ox), polymerization (Poly), or the cleaved AAT peptide (C-36 fragment) on TACE inhibition (percent inhibition of maximum activity) was compared with native AAT. *P < 0.05, native AAT or TAPI-1 versus maximal activity; §P = 0.008, polymerized AAT versus native AAT (27.5 mM). (E) Binding of ADAM-17 (250 ng) to immobilized AAT detected in the presence or absence of equimolar concentration of polymerized, C-36 fragment, or native AAT (*P = 0.005). Levels of membrane-bound AAT (F) and FcγRIIIb (G) on isolated resting control MM (green) and ZZ-AATD neutrophils before (red) and 2 days after augmentation therapy (blue). (H) The mean chemotactic index of ZZ-AATD neutrophils (black bars) toward sIC (10% v/v) in serum (50% v/v) was significantly reduced on day 2 when compared with day 0 and with day 7 after augmentation therapy. For comparative analysis, MM neutrophils treated with sIC (white bar) were set at a chemotactic index of 1. Immunoblots in A and B are representative results from 1 of 3 separate experiments. BE and H are the mean ± SEM of triplicate experiments. F and G are representative results from 1 of 3 separate experiments.
Figure 7
Figure 7. AAT binds IL-8 and modulates neutrophil chemotaxis by controlling CXCR1 binding.
(A) Binding of IL-8 (10 ng) to immobilized CXCR1 was inhibited in the presence of AAT (27.5 mM) (*P = 0.002). (B) Comparative binding of IL-8 to AAT and HSA. AAT (27.5 mM) bound approximately 20 ng IL-8. (C) Comparative binding of IL-8 to serum purified AAT and recombinant non-glycosylated (Rec non-glycos) AAT (*P = 0.001). (D) Expression levels of phospho-Akt Ser473 after IL-8 (1 ng/1 × 107 cells) treatment. Wortmannin (Wort, 100 nM) and AAT (27.5 mM), but not HSA, inhibited Akt activity efficiently (*P < 0.05 versus IL-8 control). (E) AAT (27.5 mM) significantly inhibited phosphorylation of Akt induced by 10 ng and 20 ng IL-8 (*P < 0.05 versus IL-8 control). (F) Time course of changes in Ca2+ intensity in response to IL-8 (10 ng) with or without AAT (27.5 mM). (G) AAT suppression of IL-8–induced actin cytoskeletal rearrangements. Immunoblot with anti-actin antibody for the distribution of G-actin (in the supernatant fraction [S]) and F-actin (in the pellet fraction [P]) in untreated or AAT-treated (27.5 mM) cells (top panel). Lower panel: IL-8–treated (10 ng) MM neutrophils with or without AAT or control Wort (100 nM). Distribution ratios are shown. (H) Confocal images of neutrophils (MM) undergoing chemotaxis in response to IL-8 (10 ng). F-actin at the leading edge of neutrophils (arrows) was not apparent in resting cells (Un) or cells treated with IL-8 plus AAT (27.5 mM) (×40 magnification, ×10 zoom). (I) IL-8–induced (10 ng) mean chemotactic index of ZZ-AATD neutrophils (black bars) on day 2 after therapy compared with day 0 and with day 7 after augmentation therapy. All experiments were performed in triplicate on 3 consecutive days, and each measurement is the mean ± SEM. Images in D-H are representative results of 1 of 3 separate experiments.
Figure 8
Figure 8. AAT regulates neutrophil chemotaxis through two different mechanisms.
(A) In response to IL-8, cell activation is accompanied by Akt phosphorylation and Ca2+ flux, leading to F-actin formation and cytoskeletal rearrangements. In vivo, the resting circulating MM neutrophil is surrounded by a high concentration of AAT (27.5 μM). AAT binds IL-8 and modulates CXCR1 engagement. (B) In response to sIC (i), ADAM-17 activity is increased (ii), causing shedding of the FcγRIIIb from the membrane (iii). Possible signaling mechanisms involve crosslinking with CR3, CD32a, or the fMLP receptor (iv) and migration of cells to the site of inflammation. AAT modulates chemotaxis by inhibiting ADAM-17 activity, resulting in diminished release of FcγRIIIb from the neutrophil membrane.

References

    1. Nita IM, Serapinas D, Janciauskiene SM. Alpha1-Antitrypsin regulates CD14 expression and soluble CD14 levels in human monocytes in vitro. Int J Biochem Cell Biol. 2007;39(6):1165–1176. doi: 10.1016/j.biocel.2007.02.017. - DOI - PubMed
    1. Subramaniyam D, et al. TNF-alpha-induced self expression in human lung endothelial cells is inhibited by native and oxidized alpha1-antitrypsin. Int J Biochem Cell Biol. 2008;40(2):258–271. doi: 10.1016/j.biocel.2007.07.016. - DOI - PubMed
    1. Janciauskiene S, Larsson S, Larsson P, Virtala R, Jansson L, Stevens T. Inhibition of lipopolysaccharide-mediated human monocyte activation, in vitro, by alpha1-antitrypsin. Biochem Biophys Res Commun. 2004;321(3):592–600. doi: 10.1016/j.bbrc.2004.06.123. - DOI - PubMed
    1. Stockley RA, Shaw J, Afford SC, Morrison HM, Burnett D. Effect of alpha-1-proteinase inhibitor on neutrophil chemotaxis. Am J Respir Cell Mol Biol. 1990;2(2):163–170. - PubMed
    1. Petrache I, et al. Alpha-1 antitrypsin inhibits caspase-3 activity, preventing lung endothelial cell apoptosis. Am J Pathol. 2006;169(4):1155–1166. doi: 10.2353/ajpath.2006.060058. - DOI - PMC - PubMed

MeSH terms