. 2010 Dec;120(12):4207-19.
doi: 10.1172/JCI36858. Epub 2010 Nov 8.

Manganese superoxide dismutase expression in endothelial progenitor cells accelerates wound healing in diabetic mice

Affiliations

Manganese superoxide dismutase expression in endothelial progenitor cells accelerates wound healing in diabetic mice

Eric J Marrotte et al. J Clin Invest. 2010 Dec.

Abstract

Amputation as a result of impaired wound healing is a serious complication of diabetes. Inadequate angiogenesis contributes to poor wound healing in diabetic patients. Endothelial progenitor cells (EPCs) normally augment angiogenesis and wound repair but are functionally impaired in diabetics. Here we report that decreased expression of manganese superoxide dismutase (MnSOD) in EPCs contributes to impaired would healing in a mouse model of type 2 diabetes. A decreased frequency of circulating EPCs was detected in type 2 diabetic (db/db) mice, and when isolated, these cells exhibited decreased expression and activity of MnSOD. Wound healing and angiogenesis were markedly delayed in diabetic mice compared with normal controls. For cell therapy, topical transplantation of EPCs onto excisional wounds in diabetic mice demonstrated that diabetic EPCs were less effective than normal EPCs at accelerating wound closure. Transplantation of diabetic EPCs after MnSOD gene therapy restored their ability to mediate angiogenesis and wound repair. Conversely, siRNA-mediated knockdown of MnSOD in normal EPCs reduced their activity in diabetic wound healing assays. Increasing the number of transplanted diabetic EPCs also improved the rate of wound closure. Our findings demonstrate that cell therapy using diabetic EPCs after ex vivo MnSOD gene transfer accelerates their ability to heal wounds in a mouse model of type 2 diabetes.


Figures
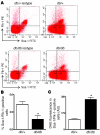
Figure 1
Figure 1. Flow cytometry analysis of mouse circulating EPCs.
(A) Typical histograms of Sca-1/Flk-1 analysis for EPCs from normal (db/+) and type 2 diabetic (db/db) mice. (B) Type 2 diabetic db/db mice possess fewer circulating EPCs compared with normal db/+ mice (*P < 0.05 vs. db/+, n = 4–5). (C) Type 2 diabetic mice exhibit elevated DHE fluorescent intensity in Sca-1/Flk-1–positive cells (*P < 0.05 vs. db/+, n = 5).
Figure 2
Figure 2. Characterization of mouse bone marrow–derived EPCs.
(A) Staining of EPCs with acLDL (red) and lectin (green). The nuclei were counterstained with Hoechst (blue). Scale bar: 50 μm. (B and C) Expression of endothelial cell-specific markers in cultured EPCs. HUVECs were used as positive controls. (B) For Flk-1 and VE-cadherin, the loaded protein amount was 80 μg/lane. (C) For eNOS, the loaded protein amount was 30 μg/lane.
Figure 3
Figure 3. Expression of antioxidant enzymes in bone marrow EPCs.
(A) mRNA levels for MnSOD, CuZnSOD, and Cat, quantified by real-time PCR. Only the MnSOD mRNA level was significantly decreased in EPCs of type 2 diabetic (db/db) mice (*P < 0.05 vs. db/+ EPCs, n = 5). (B and C) Western blot analysis demonstrating, diminished the MnSOD protein levels in db/db EPCs (*P < 0.05 vs. db/+ EPCs, n = 4). (D) Reduced MnSOD enzymatic activity in db/db EPCs (*P < 0.05 vs. db/+ EPCs, n = 4–7). (EG) High-glucose treatment reduced MnSOD expression and increased mtROS in normal EPCs (db/+ EPCs [control]) (*P < 0.05 vs. control or 25 nM mannitol-treated group, n = 5). (H) mtROS was elevated in EPCs of type 2 diabetic (db/db) mice (*P < 0.05 vs. db/+ EPCs, n = 5). Gene transfer of MnSOD (db/db-MnSOD), but not GFP (db/db-GFP), blunted the mtROS level in EPCs of db/db mice (#P < 0.05 vs. db/db EPCs, n = 5).
Figure 4
Figure 4. EPC functional assays.
Typical photographs of tube formation on Matrigel for (A) normal EPCs (db/+ EPCs), (B) type 2 diabetic EPCs (db/db EPCs), (C) type 2 diabetic db/db EPCs upon MnSOD gene therapy, and (D) type 2 diabetic db/db EPCs transfected with GFP control. (BD) Representative photographs were of EPCs isolated from the same db/db mouse. Scale bar: 650 μm. (E) MnSOD gene therapy, but not that of the GFP control, improved the ability of db/db EPCs to form tubes on Matrigel (*P < 0.05 vs. db/+ EPCs, #P < 0.05 vs. db/db-MnSOD, n = 5). Scale bar: 650 μm. (F) MnSOD knockdown by MnSOD siRNA significantly inhibited EPC-induced Matrigel tube formation (*P < 0.05 vs. control, n = 3). (G) Adhesion to vitronectin was impaired in db/db EPCs. MnSOD gene therapy of db/db EPCs had no effect on EPC adhesion (*P < 0.05 vs. db/+ EPCs, n = 5). hpf, high-power field.
Figure 5
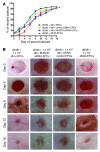
Figure 5. EPC therapy of diabetic wounds improved the rate of wound closure in type 2 diabetic mice.
The closure rate of 6-mm punch biopsies was measured every other day until day 16. Wound healing of normal db/+ mice and type 2 diabetic db/db mice represent the baseline, are the same for AC, and represent the control groups. (A) For db/+ and db/db mice that were transplanted with 1 × 10⁶ db/+ EPCs, EPCs significantly improved the rate of wound closure in db/+ mice compared with that of db/db mice transplanted with 1 × 10⁶ db/db EPCs (*P 0.01 and #P < 0.01 vs. 1 × 10⁶ db/db EPCs, n = 10 each group). Wounds of db/+ and db/db mice transplanted with 1 × 10⁶ db/+ EPCs healed at equivalent rates (P = 0.185 vs. 1 × 10⁶ db/+ EPCs, n = 10 each group). (B) MnSOD gene therapy of EPCs prior to transplantation (1 × 10⁶ db/db-AdMnSOD EPCs) significantly improved db/db EPC ability to ameliorate wound closure versus transplantation of 1 × 10⁶ control GFP db/db EPCs (db/db-AdGFP EPCs) (P < 0.01 vs. 1 × 10⁶ db/db-AdGFP EPCs, n = 10 each group). (C) Transplantation of 2 × 10⁶ db/db-AdMnSOD EPCs significantly improved the rate of wound closure versus that of 2 × 10⁶ db/db-AdGFP EPCs (P < 0.05 vs. 2 × 10⁶ db/db-AdGFP EPCs, n = 10 each group). No difference was found in the rate of wound closure among 2 × 10⁶ db/db-AdMnSOD EPCs and 1 × 10⁶ db/+ EPCs or in db/+ mice. Transplantation of 2 × 10⁶ db/db-AdMnSOD EPCs significantly improved the rate of wound closure in db/db mice versus that of other cell therapy groups (i.e., 1 × 10⁶ db/db EPCs, 1 × 10⁶ db/db-AdMnSOD EPCs, and 1 × 10⁶ db/db-AdGFP EPCs). (D) Typical photographs of wound healing for above groups.
Figure 7
Figure 7. Wound angiogenesis after 6-mm punch biopsy.
(A) There were significantly more wound capillaries in db/+ mice compared with those of all db/db groups on day 3 (#P < 0.05). (B) On day 6 of wound healing, wound angiogenesis was increased in db/+ and db/db mice treated with 1 × 10⁶ EPCs isolated from db/+ mice (db/+ EPCs) and db/db mice after MnSOD gene therapy (1 × 10⁶ db/db-AdMnSOD EPCs) or treatment with 2 × 10⁶ EPCs from db/db mice after MnSOD gene therapy (2 × 10⁶ db/db-AdMnSOD EPCs) or GFP control (2 × 10⁶ db/db-AdGFP EPCs) compared with that of db/db mice (*P < 0.05 vs. db/db mice). db/db mice without cell therapy and db/db mice treated with 1 × 10⁶ EPCs from db/db mice (db/db EPCs) and GFP control (1 × 10⁶ db/db-AdGFP EPCs) demonstrated significant less wound angiogenesis compared with that of db/+ mice (#P < 0.05 vs. db/+ mice). (C) db/db mice demonstrated significantly less wound angiogenesis compared with that of normal db/+ mice (#P < 0.05 vs. db/+ mice) on day 16. n = 4–5 in each group.
Figure 9
Figure 9. In vivo integration of transplanted EPCs on day 6 of wound healing.
At the time of wounding, 2 × 10⁶ BrdU-labeled db/+ EPCs were transplanted onto 6-mm punch biopsy wounds of db/db mice. On day 6 of wound healing, wounds were isolated, fixed, and stained for BrdU (brown stained cells). (AD) Typical photographs demonstrate EPC integration into the dermis and vascular structure. Boxed regions are shown at higher magnification to the right. The green arrow points to BrdU-positive capillaries. Scale bar: 500 μm (A); 100 μm (B and C); 50 μm (D). (EH) To ascertain that BrdU-labeled EPCs were incorporated into the capillary wall, wound tissues were stained for CD31, followed by BrdU staining. Typical photographs indicate that some BrdU-positive cells (red fluorescence) (E) were incorporated into CD31-positive vessels (green fluorescence) (F). White arrows point to CD31-positive cells. Remaining BrdU-positive cells surrounded the vessels. (G) The nucleus was counterstained with DAPI (blue fluorescence). The merged image is shown in H. The white boxed region indicates CD31/BrdU double-positive cells. Scale bar: 100 μm. Original magnification, ×40 (A); ×200 (EH); ×200 (B and C); ×400 (D).
Figure 6
Figure 6. MnSOD deficiency impedes EPC-mediated wound healing in normal mice.
(A) MnSOD knockdown by its siRNA in normal EPCs (1 × 10⁶ db/+-MnSOD-siRNA EPCs) significantly decreased their ability to ameliorate wound closure versus that of 1 × 10⁶ db/+-control-siRNA EPCs (*P < 0.01 vs. 1 × 10⁶ db/+-control-siRNA EPCs, n = 6). (B) Typical photographs of wound healing.
Figure 8
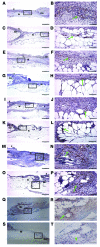
Figure 8. Typical photographs of CD31 staining on day 6 of wound healing.
(A and B) db/+ mice, (C and D) db/db mice, and (E and F) db/db mice, with EPC therapy of 1 × 10⁶ db/+ EPCs, (G and H) db/db EPCs, (I and J) db/db-AdMnSOD EPCs, (K and L) db/db-AdGFP EPCs, (M and N) 2 × 10⁶ db/db-AdMnSOD EPCs, and (O and P) 2 × 10⁶ db/db-AdGFP EPCs. Green arrows point to CD31-positive capillaries. (Q and R) Typical photographs of CD34 staining on day 6 of wound healing in db/+ mice. Green arrows point to CD34-positive capillaries. (S and T) Typical photographs of vWF staining on day 6 of wound healing in db/+ mice. Green arrows point to vWF-positive capillaries. Boxed regions are shown at higher magnification to the right. Statistic analyses are shown in Figure 7B. W, wound; Dm, dermis; E, epidermis. Scale bar: 500 μm (A, C, E, G, I, K, M, O, Q, and S); 100 μm (B, D, F, H, J, L, N, P, R, and T). Original magnification, ×40 (A, C, E, G, I, K, M, O, Q, and S); ×200 (B, D, F, H, J, L, N, P, R, and T).
Figure 10
Figure 10. EPC-conditioned media on diabetic wound healing.
Conditioned media collected from EPCs of db/+ and db/db mice were applied to the wounds of db/db mice every other day until day 16. EBM-2 was used as the control. The closure rate of 6-mm punch biopsies was measured every other day until day 16. (A) Conditioned media of db/+ EPCs and db/db EPCs similarly improved the rate of wound closure in diabetic mice, starting from day 10 (*P < 0.05 vs. db/db mice treated with EBM-2; #P<0.05 vs. db/db mice only; n = 4). However, the overall rates of wound closure were significantly slower in db/db mice receiving conditioned media than those receiving normal EPC therapy (P < 0.05 vs. db/db mice treated with db/+ EPCs, n = 4). (B) Typical photographs of wound healing.

Similar articles

Cited by

References

    1. Brem H, Sheehan P, Rosenberg HJ, Schneider JS, Boulton AJ. Evidence-based protocol for diabetic foot ulcers. Plast Reconstr Surg. 2006;117(7 suppl):193S–209S. - PubMed
    1. Jeffcoate WJ, Harding KG. Diabetic foot ulcers. Lancet. 2003;361(9368):1545–1551. doi: 10.1016/S0140-6736(03)13169-8. - DOI - PubMed
    1. Barcelos LS, et al. Human CD133+ progenitor cells promote the healing of diabetic ischemic ulcers by paracrine stimulation of angiogenesis and activation of Wnt signaling. Circ Res. 2009;104(9):1095–1102. doi: 10.1161/CIRCRESAHA.108.192138. - DOI - PMC - PubMed
    1. Roncalli JG, Tongers J, Renault MA, Losordo DW. Endothelial progenitor cells in regenerative medicine and cancer: a decade of research. Trends Biotechnol. 2008;26(5):276–283. doi: 10.1016/j.tibtech.2008.01.005. - DOI - PubMed
    1. Loomans CJ, et al. Endothelial progenitor cell dysfunction: a novel concept in the pathogenesis of vascular complications of type 1 diabetes. Diabetes. 2004;53(1):195–199. - PubMed

Publication types

MeSH terms

Substances