

Prostate cancer gene expression signature of patients with high body mass index
- PMID: 21060327
- PMCID: PMC3059752
- DOI: 10.1038/pcan.2010.44
Prostate cancer gene expression signature of patients with high body mass index
Abstract
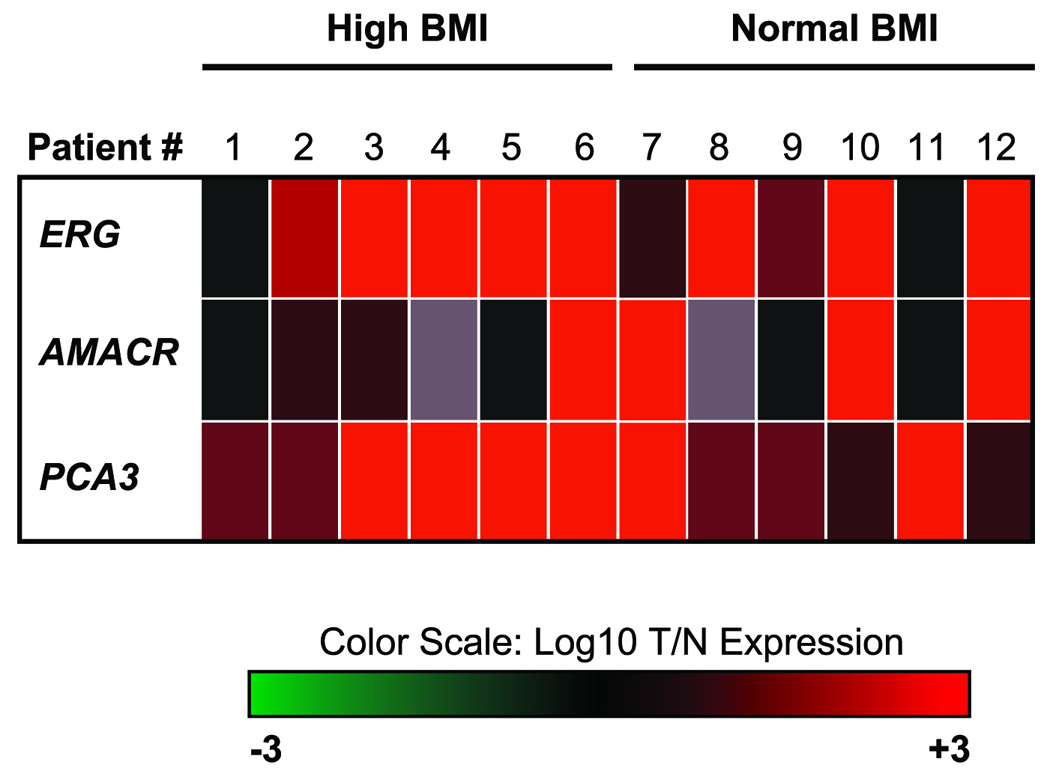
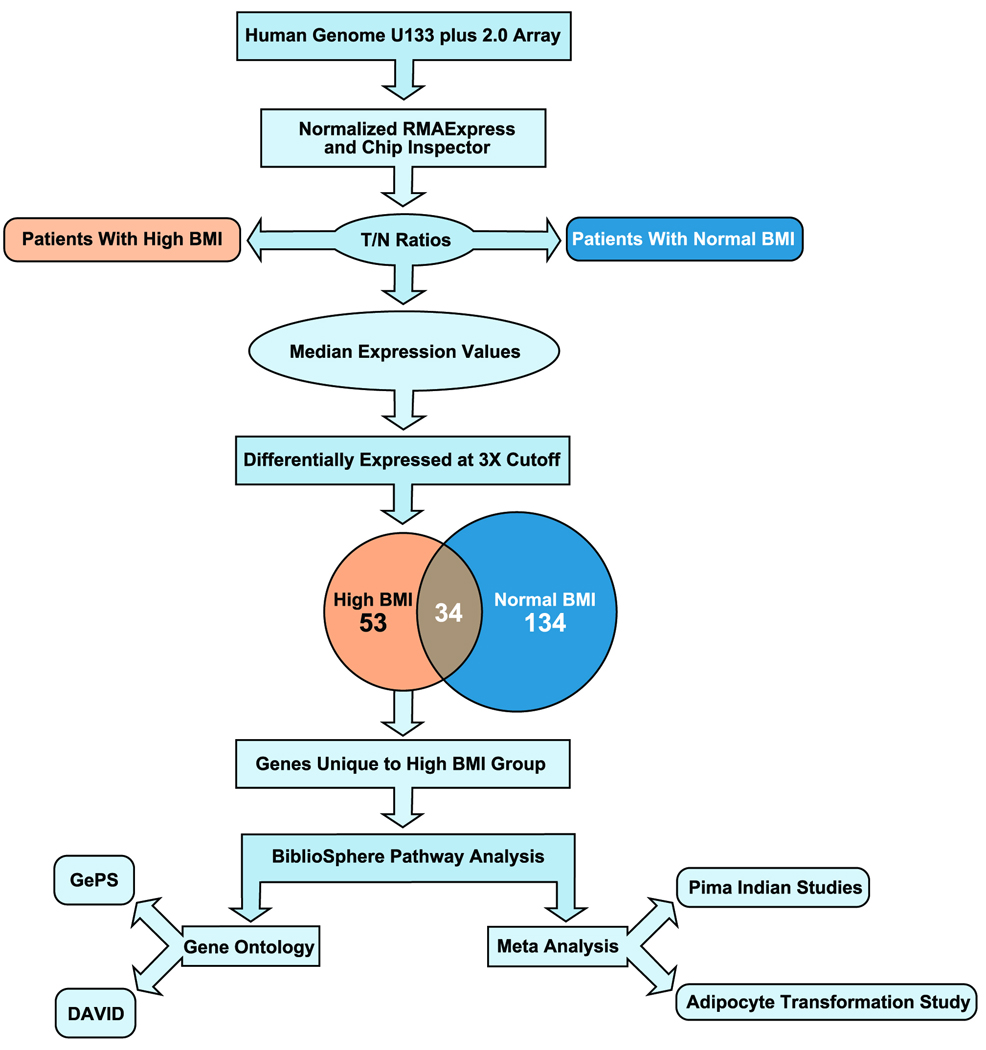
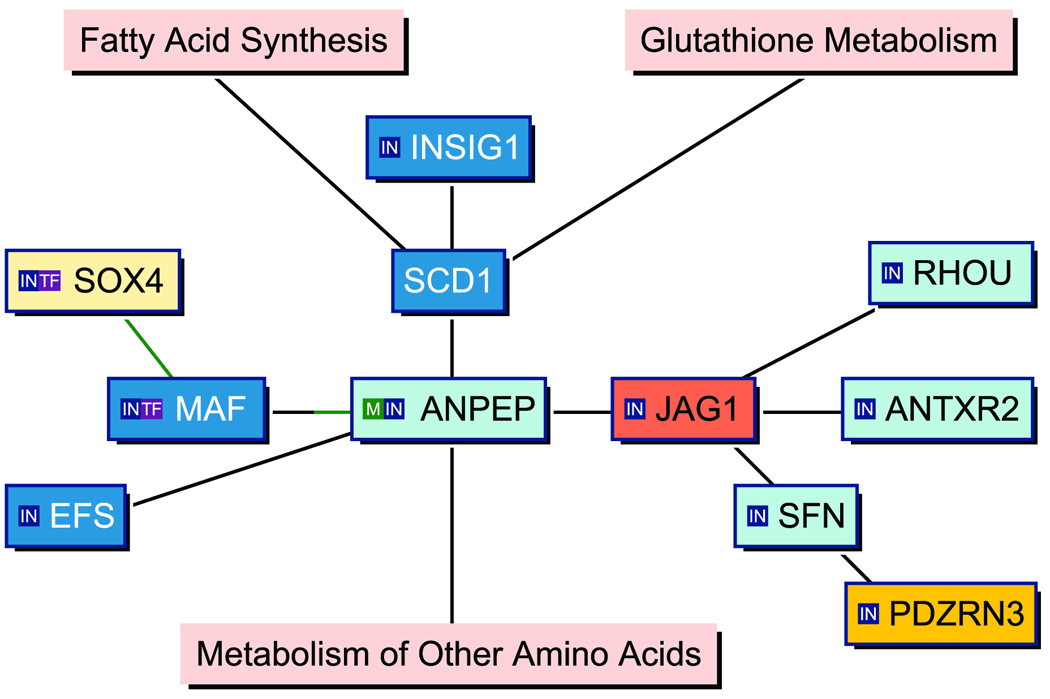
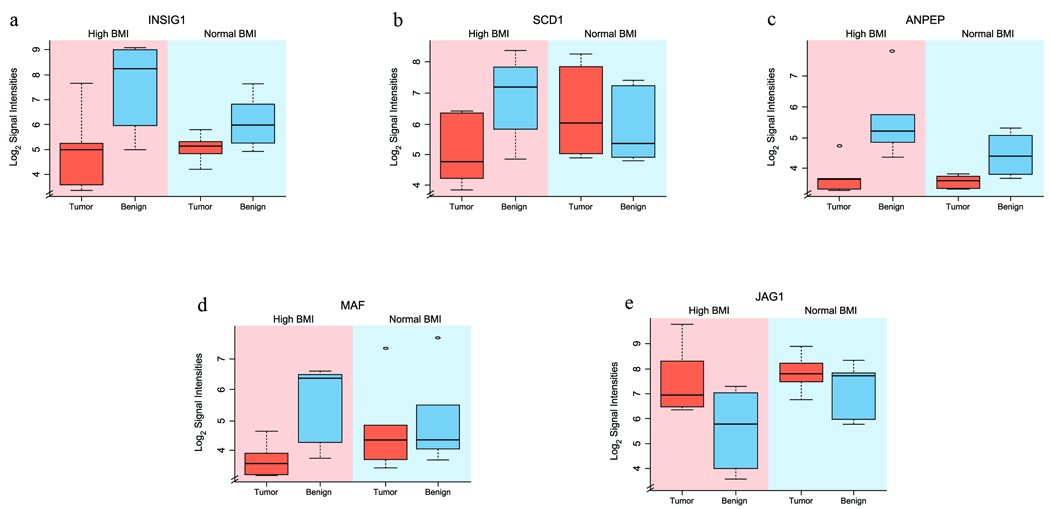
The goal of this study was to evaluate prostate cancer gene expression signatures associated with elevated body mass index (BMI). Global gene expression profiles of prostate tumor cells and matching normal epithelial cells were compared between patients with features of normal and high BMI at the time of radical prostatectomy. Knowledge-based analyses revealed an association of high BMI with altered levels of lipid metabolism and cholesterol homeostasis genes, such as stearoyl-CoA desaturase 1 (SCD1) and insulin-induced gene 1 (INSIG1), respectively, in prostate tumor cells. These genes were connected to known pathways of tumorigenesis revealed by the v-maf (musculoaponeurotic fibrosarcoma) oncogene homolog (MAF), notch receptor ligand, jagged 1 (JAG1) and the alanyl aminopeptidase (ANPEP/CD13) genes. This study highlighted that SCD1, a known target of statins, may have a mechanistic role in the recently noted beneficial effects of statin treatment in reducing biochemical recurrence of prostate cancer. An additional finding of our study is that some of the obesity-related genes were upregulated in tumor-matched normal cells within the high BMI group, when compared with normal cells within the normal BMI cohort.
Conflict of interest statement
The authors declare no competing financial interests.
Figures
Similar articles
-
Down-regulation of Notch-1 and Jagged-1 inhibits prostate cancer cell growth, migration and invasion, and induces apoptosis via inactivation of Akt, mTOR, and NF-kappaB signaling pathways.J Cell Biochem. 2010 Mar 1;109(4):726-36. doi: 10.1002/jcb.22451. J Cell Biochem. 2010. Retraction in: J Cell Biochem. 2016 Aug;117(8):1960. doi: 10.1002/jcb.25585. PMID: 20052673 Retracted.
-
Distinct biological roles for the notch ligands Jagged-1 and Jagged-2.J Biol Chem. 2009 Jun 26;284(26):17766-74. doi: 10.1074/jbc.M109.003111. Epub 2009 Apr 27. J Biol Chem. 2009. PMID: 19398556 Free PMC article.
-
Androgen receptor promotes the oncogenic function of overexpressed Jagged1 in prostate cancer by enhancing cyclin B1 expression via Akt phosphorylation.Mol Cancer Res. 2014 Jun;12(6):830-42. doi: 10.1158/1541-7786.MCR-13-0545. Epub 2014 Feb 26. Mol Cancer Res. 2014. PMID: 24574517
-
Blockade of Jagged/Notch pathway abrogates transforming growth factor β2-induced epithelial-mesenchymal transition in human retinal pigment epithelium cells.Curr Mol Med. 2014 May;14(4):523-34. doi: 10.2174/1566524014666140331230411. Curr Mol Med. 2014. PMID: 24694299 Review.
-
Anti-Jagged-1 immunotherapy in cancer.Adv Med Sci. 2022 Sep;67(2):196-202. doi: 10.1016/j.advms.2022.04.001. Epub 2022 Apr 11. Adv Med Sci. 2022. PMID: 35421813 Review.
Cited by
-
Prostate cancer risk and aggressiveness associated with the CYP1B1 4326C/G (Leu432Val) polymorphism: a meta-analysis of 2788 cases and 2968 controls.Asian J Androl. 2012 Jul;14(4):560-5. doi: 10.1038/aja.2012.4. Epub 2012 Apr 16. Asian J Androl. 2012. PMID: 22504876 Free PMC article.
-
Reconstitution of the ERG Gene Expression Network Reveals New Biomarkers and Therapeutic Targets in ERG Positive Prostate Tumors.J Cancer. 2015 Apr 1;6(6):490-501. doi: 10.7150/jca.8213. eCollection 2015. J Cancer. 2015. PMID: 26000039 Free PMC article.
-
Gene expression profiling of prostate tissue identifies chromatin regulation as a potential link between obesity and lethal prostate cancer.Cancer. 2017 Nov 1;123(21):4130-4138. doi: 10.1002/cncr.30831. Epub 2017 Jul 12. Cancer. 2017. PMID: 28700821 Free PMC article.
-
Presurgical weight loss affects tumour traits and circulating biomarkers in men with prostate cancer.Br J Cancer. 2017 Oct 24;117(9):1303-1313. doi: 10.1038/bjc.2017.303. Epub 2017 Sep 7. Br J Cancer. 2017. PMID: 28881355 Free PMC article. Clinical Trial.
-
Investigation of the molecular mechanisms underlying metastasis in prostate cancer by gene expression profiling.Exp Ther Med. 2016 Aug;12(2):925-932. doi: 10.3892/etm.2016.3376. Epub 2016 May 20. Exp Ther Med. 2016. PMID: 27446297 Free PMC article.
References
-
- Moul JW, Sesterhenn IA, Connelly RR, Douglas T, Srivastava S, Mostofi FK, et al. Prostate-specific antigen values at the time of prostate cancer diagnosis in African-American men. JAMA. 1995;274:1277–1281. - PubMed
-
- Schaid DJ. The complex genetic epidemiology of prostate cancer. Hum Mol Genet. 2004;13:103–121. - PubMed
-
- Hankey BF, Feuer EJ, Clegg LX, Hayes RB, Legler JM, Prorok PC, et al. Cancer surveillance series: interpreting trends in prostate cancer--part I: Evidence of the effects of screening in recent prostate cancer incidence, mortality, and survival rates. J Natl Cancer Inst. 1999;91:1017–1024. - PubMed
Publication types
MeSH terms
Substances
Grants and funding
LinkOut - more resources
Full Text Sources
Other Literature Sources
Medical
Miscellaneous
