. 2010 Oct 29;5(10):e13710.
doi: 10.1371/journal.pone.0013710.

Anti-angiogenic therapy induces integrin-linked kinase 1 up-regulation in a mouse model of glioblastoma

Affiliations

Anti-angiogenic therapy induces integrin-linked kinase 1 up-regulation in a mouse model of glioblastoma

Chiara Verpelli et al. PLoS One. .

Abstract

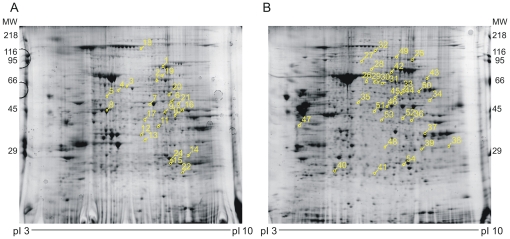
Background: In order to improve our understanding of the molecular pathways that mediate tumor proliferation and angiogenesis, and to evaluate the biological response to anti-angiogenic therapy, we analyzed the changes in the protein profile of glioblastoma in response to treatment with recombinant human Platelet Factor 4-DLR mutated protein (PF4-DLR), an inhibitor of angiogenesis.

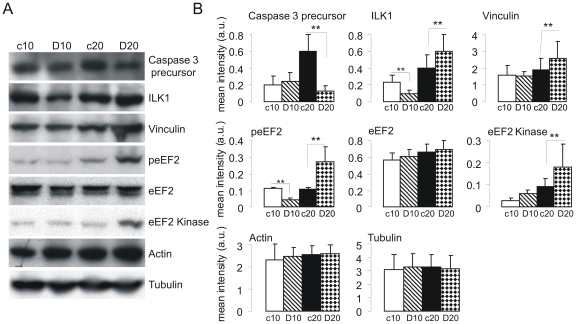
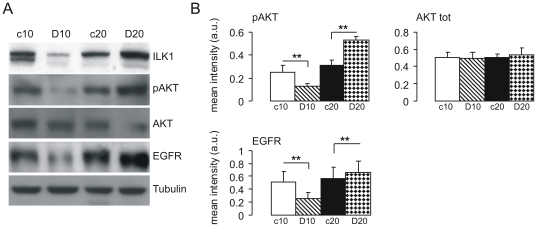
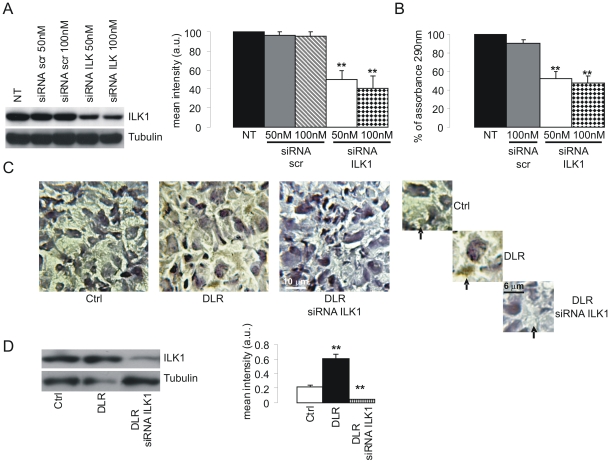
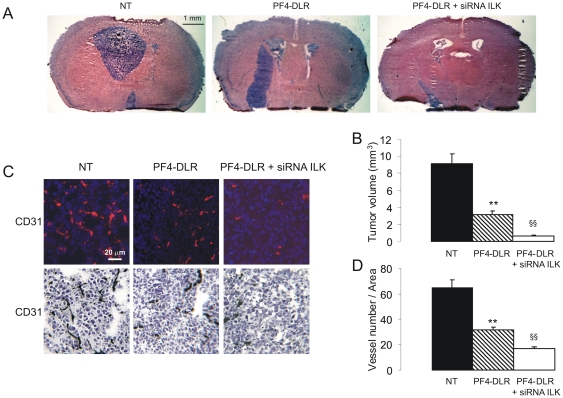
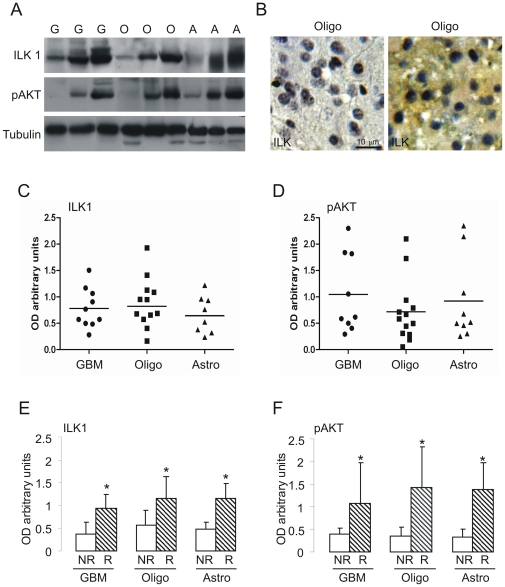
Methodology/principal findings: U87-derived experimental glioblastomas were grown in the brain of xenografted nude mice, treated with PF4-DLR, and processed for proteomic analysis. More than fifty proteins were differentially expressed in response to PF4-DLR treatment. Among them, integrin-linked kinase 1 (ILK1) signaling pathway was first down-regulated but then up-regulated after treatment for prolonged period. The activity of PF4-DLR can be increased by simultaneously treating mice orthotopically implanted with glioblastomas, with ILK1-specific siRNA. As ILK1 is related to malignant progression and a poor prognosis in various types of tumors, we measured ILK1 expression in human glioblastomas, astrocytomas and oligodendrogliomas, and found that it varied widely; however, a high level of ILK1 expression was correlated to a poor prognosis.

Conclusions/significance: Our results suggest that identifying the molecular pathways induced by anti-angiogenic therapies may help the development of combinatorial treatment strategies that increase the therapeutic efficacy of angiogenesis inhibitors by association with specific agents that disrupt signaling in tumor cells.


Conflict of interest statement

Competing Interests: The authors have declared that no competing interests exist.

Figures

Figure 1
Figure 1. Two-dimensional PAGE gels analysis of PF4-DLR treated glioblastomas.
In order to identify protein expression changes in mice treated with PF4-DLR, samples of treated and untreated glioblastomas were analyzed by means of two-dimensional PAGE gels. The tissues were prepared as described in Materials and Methods: 900 µg of protein underwent two-dimensional PAGE using a first dimension pH NL gradient of 3-10% and a second dimension gradient of 9–16% acrylamide. The gels were stained with colloidal Coomassie blue. A) example of gel obtained from glioblastomas treated with PF4-DLR for 10 days; B) example of gel obtained from glioblastomas treated with PF4-DLR for 20 days. At least seven gels per condition were used to analyze protein changes. The analyzed spots and related identification numbers are shown in yellow.
Figure 2
Figure 2. Immunoblotting validation of a set of proteins identified as being differentially expressed in glioblastomas treated with PF4-DLR.
Tissue lysates of glioblastomas treated with PF4-DLR for 10 or 20 days (D10 and D20) or untreated (c10 and c20) were prepared as described in Materials and Methods, and the proteins were resolved on 6–12% PAGE gels. A) The proteins were blotted onto a nitrocellulose membrane and detected with antisera raised against the individual proteins indicated on the right side of each panel. B) Histograms of the mean band intensity (± SEM) of each protein. *p<0.05, t test.
Figure 3
Figure 3. Immunoblotting analysis of ILK1, pAKT and EGFR in PF4-DLR treated glioblastomas.
Tissue lysates of the treated (D10 and D20) and untreated (c10 and c20) tumors were prepared as described in Materials and Methods, and the proteins were resolved on 10–12% PAGE gels. A) The proteins were blotted onto a nitrocellulose membrane and detected with antibodies raised against the individual proteins indicated on the right side of each panel. B) Histograms of the mean band intensity (± SEM) of each protein. *p<0.05, t test.
Figure 4
Figure 4. Characterization of specific siRNA for ILK1.
A) U87 cells were transiently transfected with ILK1-specific siRNA using Lipofectamine 2000 or nontransfected (NT) as described in Materials and Methods, and harvested 48 h later; untreated cells or a non-silencing scrambled siRNA (Scr) were included as controls. ILK1 expression was specifically reduced in the cells transfected with ILK1 siRNA. Histogram shows of the mean band intensity (± SEM) of each protein. **p<0.01, one-way ANOVA with post hoc Tuckey test.B). Effect of the administration of ILK1 siRNA in vitro using the MTT test of cell proliferation. ILK1 siRNA 50 nM and 100 nM respectively led to the 48% and 53% inhibition of cell proliferation (columns 3 and 4); 100 nM of scrambled siRNA (Scr 100 nM) did not reduce cell proliferation (compare columns 1 and 2). NT: not transfected. Histogram shows mean % of assorbance at 290 nm. **p<0.01, one-wayANOVA with post hoc Tuckey test. C and D) Effect of the administration of ILK1 siRNA in vivo; representative immunohistochemistry (C) (Scale bar  = 10 µm) and Western Blot (D) analysis of ILK1 expression in tumors from untreated mice (ctrl), and mice treated with PF4-DLR alone (DLR) or PF4-DLR plus ILK1 siRNA (DLR siRNA ILK1). ILK1 levels were significantly reduced in the mice treated with ILK1 siRNA. Histogram in D shows of the mean band intensity (± SEM) of each protein. **p<0.01, one-way ANOVA with post hoc Tuckey test.
Figure 5
Figure 5. Effect of PF4-DLR + siRNA ILK1 treatment on glioblastomas development in vivo.
A) Representative hematoxylin-eosin stained histological sections of brains from mice xenografted with U87-MG and treated or not (NT) with PF4-DLR or PF4-DLR plus ILK1 siRNA (PF4-DLR + siRNA ILK1). Scale bar  = 1 mm. B) Tumor volumes were quantified from six different brains per group, and the results expressed as mean values ± SEM. Significant differences between groups are indicated (one-way ANOVA followed by Tukey's post hoc test, **p< 0.05 PF4-DLR versus NT; §§p< 0.05 PF4-DLR + siRNA ILK1 versus PF4-DLR). C) Representative image of vessel staining (blue: DAPI, red: anti CD31) and immunohistochemestry of CD31. Scale bar 20 µm. D) Vessels were counted in the tumor area and were found significantly reduced in animals treated with PF4-DLR or PF4-DLR plus ILK1 siRNA (PF4-DLR + siRNA ILK1). Significant differences between groups are indicated (one-way ANOVA followed by Tukey's post hoc test **p<0.05 PF4-DLR versus NT; §§p<0.05 PF4-DLR + siRNA ILK1 versus PF4-DLR).
Figure 6
Figure 6. Immunoblotting analysis of ILK1 and pAKT levels in biopsies from patients.
The expression level of ILK1 and pAKT were analyzed in biopsies from patients with glioblastomas (G), oligodendrogliomas (O) or astrocytomas (A). The tissue lysates were prepared as described in Materials and Methods, and the proteins separated in 10% gels. A) Proteins blotted onto a nitrocellulose membrane and detected using antibodies raised against the individual proteins indicated on the left side of each panel. B) Representative immunohistochemistry of ILK1 levels in different biopsies. C and D) The graphs show histological ILK1 and pAKT levels in different patients with the same type of tumor. E and F) Patients divided on the basis of the time of recurrence (NR: long-term recurrence, more than one year after treatment; R: short-term recurrence, less than four months after treatment). The histograms indicate the mean band intensity (± SEM) for each protein. *p<0.05, t test. The expression of ILK1 and pAKT was significantly upregulated in the subset of patients with a poor prognosis, regardless of the type of glioma.

Similar articles

Cited by

References

    1. Sundberg C, Nagy JA, Brown LF, Feng D, Eckelhoefer IA, et al. Glomeruloid microvascular proliferation follows adenoviral vascular permeability factor/vascular endothelial growth factor-164 gene delivery. Am J Pathol. 2001;158:1145–1160. - PMC - PubMed
    1. Nagy JA, Vasile E, Feng D, Sundberg C, Brown LF, et al. Vascular permeability factor/vascular endothelial growth factor induces lymphangiogenesis as well as angiogenesis. J Exp Med. 2002;196:1497–1506. - PMC - PubMed
    1. Groothuis DR, Pasternak JF, Fischer JM, Blasberg RG, Bigner DD, et al. Regional measurements of blood flow in experimental RG-2 rat gliomas. Cancer Res. 1983;43:3362–3367. - PubMed
    1. Vajkoczy P, Menger MD. Vascular microenvironment in gliomas. Cancer Treat Res. 2004;117:249–262. - PubMed
    1. Bergers G, Hanahan D. Modes of resistance to anti-angiogenic therapy. Nat Rev Cancer. 2008;8:592–603. - PMC - PubMed

Publication types

MeSH terms

Substances