. 2010 Oct 28;6(10):e1001166.
doi: 10.1371/journal.ppat.1001166.

Phylodynamics and human-mediated dispersal of a zoonotic virus

Affiliations

Phylodynamics and human-mediated dispersal of a zoonotic virus

Chiraz Talbi et al. PLoS Pathog. .

Erratum in

  • PLoS Pathog. 2011;7(1). doi: 10.1371/annotation/66c3b26f-7b78-4412-96d0-c960b8d74b50. Jalal, Nourlil [corrected to Nourlil, Jalal]

Abstract

Understanding the role of humans in the dispersal of predominantly animal pathogens is essential for their control. We used newly developed Bayesian phylogeographic methods to unravel the dynamics and determinants of the spread of dog rabies virus (RABV) in North Africa. Each of the countries studied exhibited largely disconnected spatial dynamics with major geopolitical boundaries acting as barriers to gene flow. Road distances proved to be better predictors of the movement of dog RABV than accessibility or raw geographical distance, with occasional long distance and rapid spread within each of these countries. Using simulations that bridge phylodynamics and spatial epidemiology, we demonstrate that the contemporary viral distribution extends beyond that expected for RABV transmission in African dog populations. These results are strongly supportive of human-mediated dispersal, and demonstrate how an integrated phylogeographic approach will turn viral genetic data into a powerful asset for characterizing, predicting, and potentially controlling the spatial spread of pathogens.


Conflict of interest statement

The authors have declared that no competing interests exist.

Figures
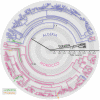
Figure 1
Figure 1. MCC tree of 287 sequences of the Africa 1 clade, estimated from the N, P and G-L genes and intergenic regions of dog RABV, and showing the spatial structure of the viral lineages.
Branches are colored according to the locations of viral sampling. Branch lengths are estimated in time units (years) as indicated by the time bar. Posterior clade probability values (>0.9) are shown for key nodes. Although Melilla and Ceuta are considered Spanish locations they are in fact Moroccan enclaves. As such they do not represent virus dispersal across the strait of Gibraltar.
Figure 2
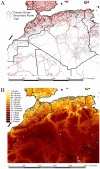
Figure 2. Road network, accessibility and sampling locations of RABV samples.
The road network and the accessibility are shown in panels A and B, respectively The border between the countries is indicated by dark lines. Specific locations were unavailable for Tunisian samples. The color gradient indicates the estimated travel time to the nearest city of population greater than 50,000 people, with yellow at one extreme indicating low travel times (<30 min) and red at the other extreme indicating long travel times (>10 days). The data are available for download from http://gem.jrc.ec.europa.eu/.
Figure 3
Figure 3. Short-time virus gene flow events in Algeria and Morocco.
Branches that harbor an expected state change (different location at parent and daughter node) were binned according to the distance covered along that branch in Algeria (A) and Morocco (B). This was carried out separately for branches along which state changes occurred in less than 1 year, and between 1 and 2 years.
Figure 4
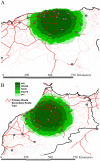
Figure 4. Spatial simulation based on the inferred evolutionary histories and epidemiological parameters of rabies spread in Algeria (A) and Morocco (B).
We report the simulated spread using contours represented under the form of polygons. Different contours represent different simulation scenarios: for time = 0.25 to time = 1.0, we force the virus to move consistently in the same direction for successive transmissions during a time period of three months to one year. The dark green contour in the centre represents simulated spread with each infection taking a new and random direction, while the increasingly lighter ones represent time = 0.25 to time = 1.0.

References

    1. Knobel DL, Cleaveland S, Coleman PG, Fevre EM, Meltzer MI, et al. Re-evaluating the burden of rabies in Africa and Asia. Bull World Health Organ. 2005;83:360–368. - PMC - PubMed
    1. Cleaveland S, Meslin FX, Breiman R. Dogs can play useful role as sentinel hosts for disease. Nature. 2006;440:605. - PubMed
    1. Fevre EM, Kaboyo RW, Persson V, Edelsten M, Coleman PG, et al. The epidemiology of animal bite injuries in Uganda and projections of the burden of rabies. Trop Med Int Health. 2005;10:790–798. - PubMed
    1. Ly S, Buchy P, Heng NY, Ong S, Chhor N, et al. Rabies situation in cambodia. PLoS Negl Trop Dis. 2009;3:e511. - PMC - PubMed
    1. Nel LH, Rupprecht CE. Emergence of lyssaviruses in the Old World: the case of Africa. Curr Top Microbiol Immunol. 2007;315:161–193. - PubMed

Publication types