. 2010 Oct 28;6(10):e1001167.
doi: 10.1371/journal.ppat.1001167.

Nucleocapsid promotes localization of HIV-1 gag to uropods that participate in virological synapses between T cells

Affiliations

Nucleocapsid promotes localization of HIV-1 gag to uropods that participate in virological synapses between T cells

G Nicholas Llewellyn et al. PLoS Pathog. .

Abstract

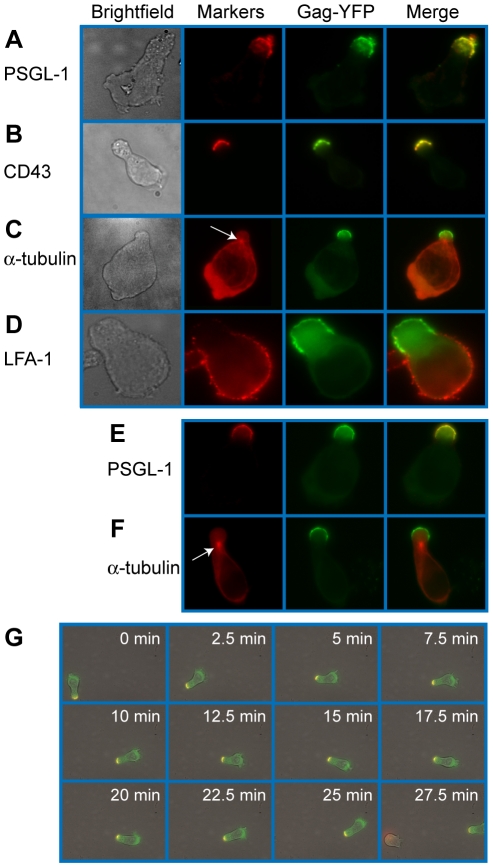
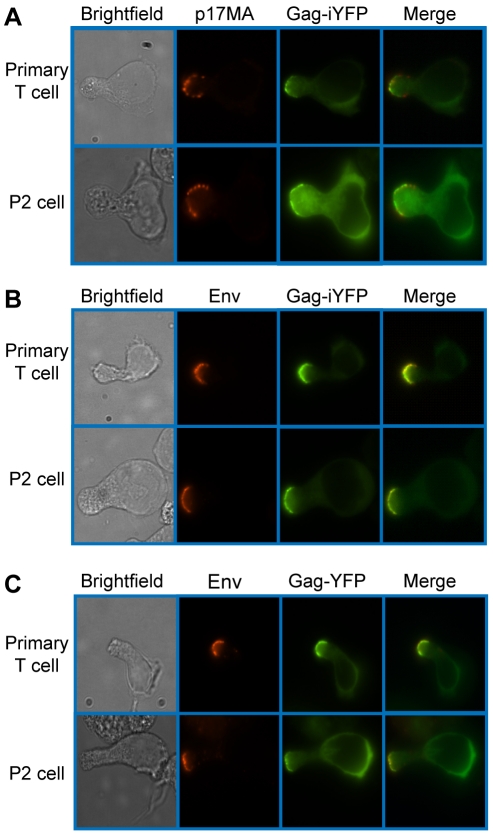
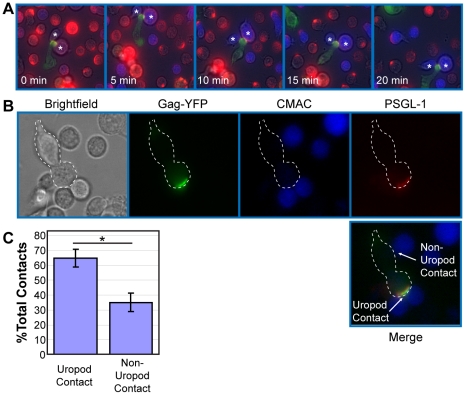
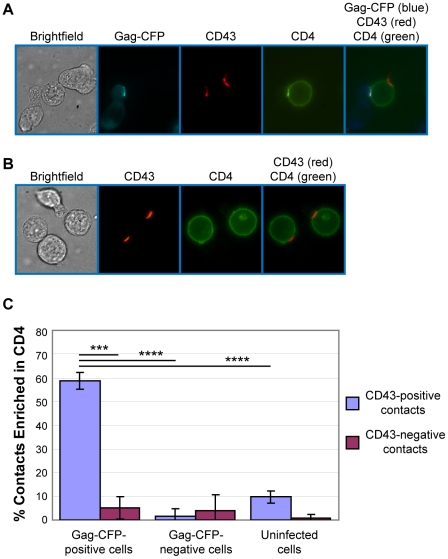
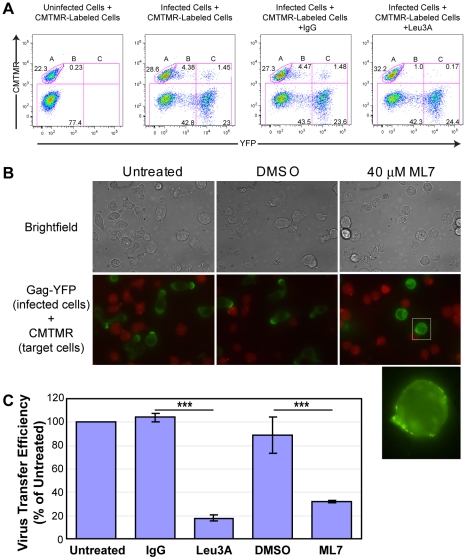
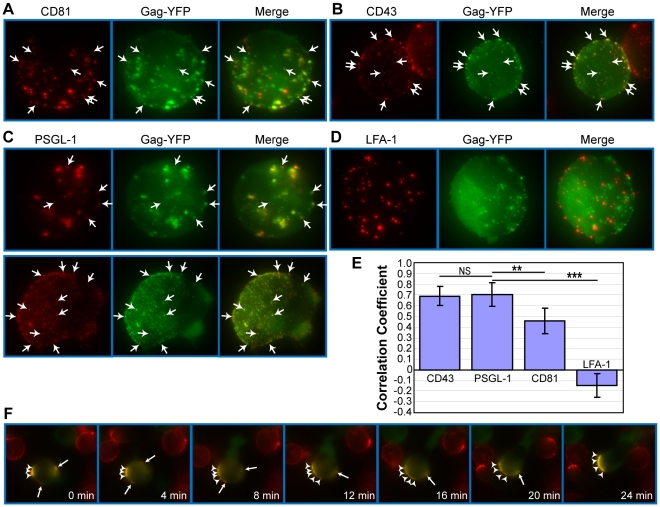
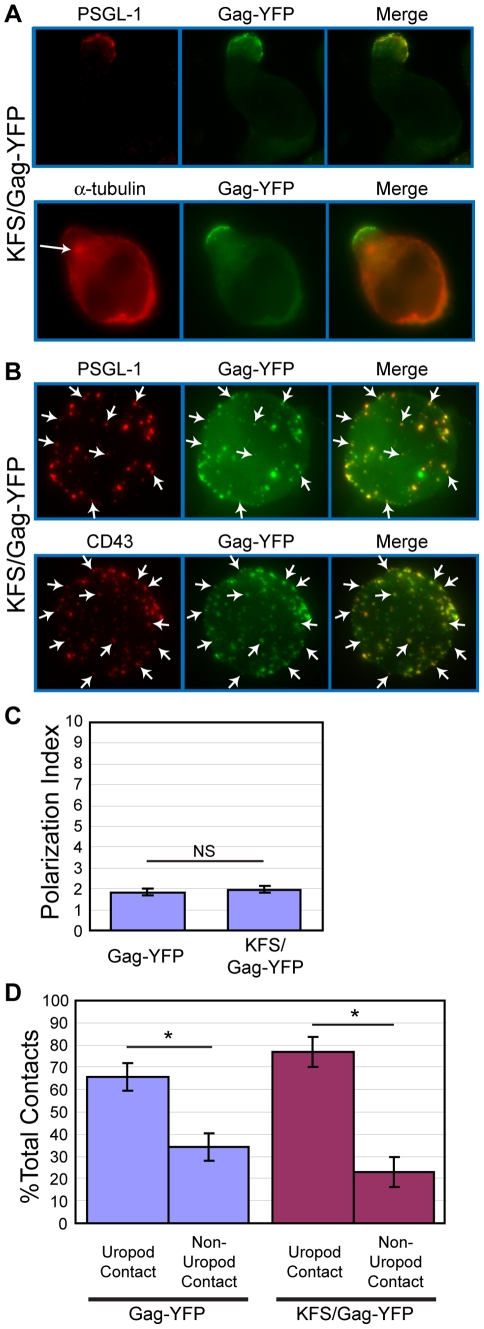
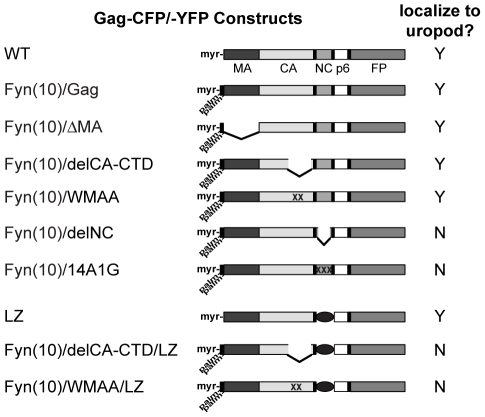
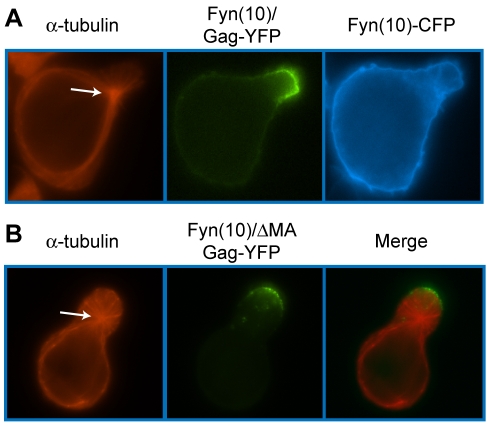
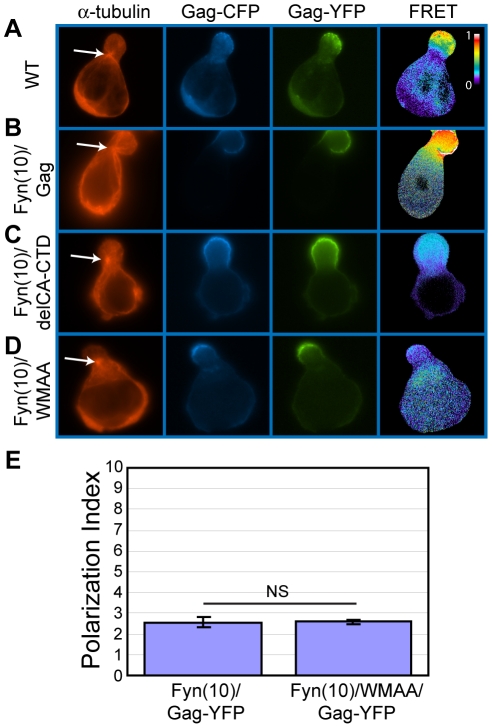
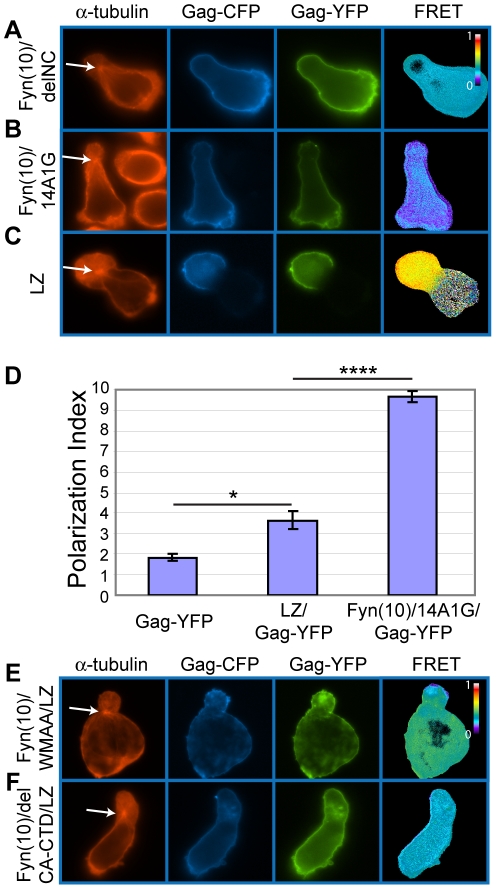
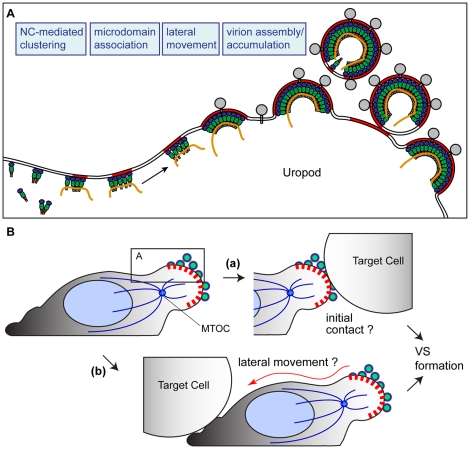
T cells adopt a polarized morphology in lymphoid organs, where cell-to-cell transmission of HIV-1 is likely frequent. However, despite the importance of understanding virus spread in vivo, little is known about the HIV-1 life cycle, particularly its late phase, in polarized T cells. Polarized T cells form two ends, the leading edge at the front and a protrusion called a uropod at the rear. Using multiple uropod markers, we observed that HIV-1 Gag localizes to the uropod in polarized T cells. Infected T cells formed contacts with uninfected target T cells preferentially via HIV-1 Gag-containing uropods compared to leading edges that lack plasma-membrane-associated Gag. Cell contacts enriched in Gag and CD4, which define the virological synapse (VS), are also enriched in uropod markers. These results indicate that Gag-laden uropods participate in the formation and/or structure of the VS, which likely plays a key role in cell-to-cell transmission of HIV-1. Consistent with this notion, a myosin light chain kinase inhibitor, which disrupts uropods, reduced virus particle transfer from infected T cells to target T cells. Mechanistically, we observed that Gag copatches with antibody-crosslinked uropod markers even in non-polarized cells, suggesting an association of Gag with uropod-specific microdomains that carry Gag to uropods. Finally, we determined that localization of Gag to the uropod depends on higher-order clustering driven by its NC domain. Taken together, these results support a model in which NC-dependent Gag accumulation to uropods establishes a preformed platform that later constitutes T-cell-T-cell contacts at which HIV-1 virus transfer occurs.


Conflict of interest statement

The authors have declared that no competing interests exist.

Figures

Figure 1
Figure 1. Gag stably localizes to the uropod in polarized T cells.
Primary T cells (A–D) and P2 cells (E–F) expressing Gag-YFP (green) were immunostained for uropod and non-uropod markers as described in the Materials and Methods section, and observed using an epifluorescence microscope. Uropods were identified by the presence of PSGL-1 (A and E) and CD43 (B) as well as by the location of the MTOC determined by immunostaining with anti- α-tubulin (C and F, arrows). LFA-1 (D) is a known non-uropod marker and served as a negative control. G) Cells expressing Gag-YFP (green) were immunostained with anti-PSGL-1 prelabeled by AlexaFluor-594-conjugated anti-mouse IgG (red). Images were acquired every 30 s for 30 min as the polarized cell migrated through the field. Yellow color indicates colocalization of PSGL-1 and Gag-YFP.
Figure 2
Figure 2. Mature Gag and Env localize to the uropod.
Primary CD4+ T cells and P2 cells were infected with a VSV-G-pseudotyped HIV-1 encoding Gag-iYFP (green) (A and B) or Gag-YFP (green) (C). A) For detection of mature Gag, cells were fixed, permeabilized, and immunostained with anti-p17MA (red) as described in Materials and Methods and observed with an epifluorescence microscope. B) and C) For detection of Env on the cell surface, infected cells were incubated with anti-gp120 (IgG1 b12) and subsequently with AlexaFluor-594-conjugated anti-human IgG prior to fixation as described in Materials and Methods.
Figure 3
Figure 3. Infected polarized T cells form contacts with target cells via their uropods.
A) Primary T cells expressing Gag-YFP (green) were immunostained with an anti-PSGL-1 antibody (red) as described in Figure 1G and cocultured with fresh primary T cells from the same donor stained with the fluorescent dye CMAC (blue). Regions of colocalization between Gag and PSGL-1 are shown in yellow. Live cell images were taken every 30 s for 20 min. A series of images with 5-min intervals is shown. Note that the uropod, enriched in Gag-YFP and PSGL-1, mediates stable contacts with target cells (*). B) Examples of uropod- and non-uropod-mediated contacts between a Gag-YFP expressing primary T cell (dotted white outline) with CMAC-labeled primary T cells are shown. C) Uropod-mediated and non-uropod-mediated contacts were counted for a total of 74 polarized Gag-YFP-positive cells contacting CMAC-labeled cells in two independent experiments. P values were determined using Student's t test. *, P<0.05.
Figure 4
Figure 4. Gag-positive uropods form contacts enriched in CD4.
A) P2 cells expressing Gag-CFP (cyan; pseudo-colored in blue in the merge panel) were immunostained with anti-CD43 and AlexaFluor-594-conjugated anti-mouse IgG (red). Subsequently, these cells were cocultured with SupT1 cells prelabeled with FITC-conjugated anti-CD4 (green) for 3 h and examined by live cell microscopy. A target cell (center) in contact with both Gag-CFP-positive (left) and Gag-CFP-negative (right) cells is shown. B) Uninfected P2 cells were immunostained with anti-CD43 and co-cultured with SupT1 cells prelabeled for CD4 as done in (A). C) In experiments represented in panels A and B, junctions between target SupT1 cells and Gag-CFP-expressing, non-Gag-CFP-expressing, or uninfected P2 cells were classified into uropod-mediated and non-uropod-mediated contacts based on the presence of CD43. The percentage of contacts with accumulation of CD4 relative to total contacts was determined for each category. Data from three independent experiments were shown as means +/−standard deviation. P values were determined using Student's t test. ***, P<0.001; ****, P<0.0001. Numbers of contacts detected and examined for CD4 accumulation in each of these three experiments are: Gag-CFP-positive/CD43-positve contacts, 56, 56, 57 (total 169); Gag-CFP-positive/CD43-negative contacts, 21,17,18 (total 56); Gag-CFP-negative/CD43-positive contacts, 26, 35, 39 (total 100); Gag-CFP-negative/CD43-negative contacts, 17, 24, 28 (total 69); uninfected/CD43-positve contacts, 56, 67, 86 (total 209); and uninfected/CD43-negative contacts, 20, 38, 55 (total 113).
Figure 5
Figure 5. ML7 depolarizes cell morphology and Gag localization and reduces cell-to-cell transfer of Gag-YFP.
A) Transfer of Gag-YFP fluorescence from infected P2 cells to CMTMR-stained SupT1 target cells during a 3-h coculture period was measured by flow cytometry. ML7, DMSO, or antibodies, along with 10 µg/ml cycloheximide, were added at the beginning of the coculture period. Flow cytometry plots for CMTMR-labeled target cells co-cultured with uninfected cells as well as CMTMR-labeled target cells cocultured with Gag-YFP-expressing infected cells in the presence or absence of IgG or Leu3A are shown. Gate A, CMTMR-labeled target cells; gate B, double positive cells representing target cells with transferred Gag-YFP particles; and gate C, YFP-expressing cells either fused or conjugated to CMTMR-labeled target cells. B) Images of cycloheximide-treated P2 cells expressing Gag-YFP were acquired after 3-h coculture with CMTMR-stained SupT1 cells in the presence or absence of DMSO or ML7. Note that almost all the cells adopt round unpolarized morphology upon treatment with ML7 and that ML7-treated infected cells show dispersed Gag-YFP localization. The latter point is clearer in the higher magnification image (bottom panel) of a region specified in the middle row. Also note that the cell density of the cocultures in experiments shown in panel A (images shown in Figure S3 and discussed in Text S1) is 10 fold higher than in panel B. C) Relative efficiencies of cell-to-cell virus transfer were calculated as the percentage of double positive cells out of the total CMTMR-labeled cells (Virus transfer efficiency = B/(A+B+C)*100; error bars represent standard deviation). P values were determined using Student's t test. ***, P<0.001.
Figure 6
Figure 6. Gag associates with uropod-specific microdomains that carry Gag to the uropod.
Unpolarized P2 cells expressing Gag-YFP (green) were examined for copatching with CD81 (A), CD43 (B), PSGL-1 (C), or LFA-1 (D). Cells were incubated with specific primary mouse monoclonal antibodies premixed with the fluorescent secondary antibody (red) followed by fixation. Z series of images of morphologically unpolarized cells were acquired and used to generate maximum projection images of each color using Metamorph 6 software. Merged images are shown in the right column of each panel. Several small copatching puncta are indicated by arrows. E) Quantification of copatching. Correlation coefficients between Gag-YFP and cell surface marker signals were calculated from a total of 18 cells for each marker. A value of 1 represents perfect colocalization, a value of -1 represents complete segregation, and a value of 0 represents a random distribution. P values were determined using Student's t test. NS, not significant. **, P<0.01. ***, P<0.001. F) Time lapse images of a Gag-YFP-expressing T cell during repolarization. Gag-YFP(green)-expressing P2 cells were immunostained for PSGL-1 (red) as described for panels A–D. Cells were then depolarized by incubation at 4°C for 30 min. Approximately 5 min after chamber coverslips containing depolarized cells were transferred to the microscope stage maintained at 37°C, acquisition of live cell images at indicated time points was begun. Note that the small patches (arrows) migrate and coalesce to the large patch (arrowheads) at the cell pole that eventually forms the uropod.
Figure 7
Figure 7. Env is not required for Gag localization to the uropod.
A) P2 cells expressing KFS/Gag-YFP (green) were immunostained after fixation with anti-PSGL-1 (red, upper panel) or anti- α-tubulin (red, lower panel, arrow indicates MTOC) as described for Figure 1. B) KFS/Gag-YFP-expressing P2 cells were immunostained for PSGL-1 or CD43 (red) using the co-patching method as described for Figure 6, and Z-series of images of unpolarized cells were acquired. Maximum projections of each color were generated from the Z stacks and merged to examine colocalization (yellow). Several small copatching puncta are indicated by arrows. C) The Gag polarization index was determined as described in the Materials and Methods section for cells expressing Gag-YFP and KFS/Gag-YFP. Four separate experiments (32, 23, 39, and 37 cells each) for a total of 131 cells for Gag-YFP and 3 separate experiments (34, 48, and 30 cells each) for a total of 112 cells for KFS/Gag-YFP were used for quantification of Gag polarization. P values were determined using Student's t test. NS, not significant. D) Cell-cell contact assays were performed as in Figure 3. This graph compares the results of Figure 3 to the results obtained with cells expressing KFS/Gag-YFP, which had been obtained concurrently. P values were determined using Student's t test. *, P<0.05.
Figure 8
Figure 8. Gag derivatives used in this study and their localization pattern.
HIV-1 molecular clones that express Gag-fluorescent protein fusions (WT Gag-YFP/-CFP) were generated. Deletions or amino acid substitutions were created in the MA domain (Fyn(10)/ΔMA/Gag-YFP/-CFP), CA domain (Fyn(10)/delCA-CTD/Gag-YFP/-CFP and Fyn(10)/WMAA/Gag-YFP/-CFP) and the NC domain (Fyn(10)/delNC/Gag-YFP/-CFP, Fyn(10)/14A1G/Gag-YFP/-CFP and LZ/Gag-YFP/-CFP). Gag derivatives containing LZ replacement of NC combined with the CA mutations were also used (Fyn(10)/delCA-CTD/LZ/Gag-YFP/-CFP and Fyn(10)/WMAA/LZ/Gag-YFP/-CFP). The Fyn(10) sequence, a single myristylation and dual palmitoylation signal, was added to the N terminus of all Gag derivatives except WT Gag-CFP/-YFP and LZ/Gag-CFP/-YFP. Results as to whether these Gag derivatives localize specifically to the uropod (Y) or distribute over the entire cell surface (N) are summarized in the right column.
Figure 9
Figure 9. The MA sequence is not required for Gag localization to the uropod.
A) P2 cells were co-transfected with plasmids that express Fyn(10)/Gag-YFP (green) and Fyn(10)-CFP (blue). Cells were then stained for α-tubulin (red, arrow indicates MTOC). B) Cells expressing Fyn(10)/ΔMA/Gag-YFP (green) were immunostained with anti-α-tubulin (red, arrow indicates MTOC).
Figure 10
Figure 10. CA-mediated dimerization is not required for Gag localization to the uropod.
A-D) P2 cells expressing Gag-YFP (green) and Gag-CFP (blue) or their derivatives were stained for α-tubulin (red) to identify the MTOC. Multimerization efficiency of each Gag mutant was measured by FRET. A) WT Gag-YFP/-CFP, B) Fyn(10)/Gag-YFP/-CFP, C) Fyn(10)/delCA-CTD/Gag-YFP/-CFP, and D) Fyn(10)/WMAA/Gag-YFP/CFP. Note that Gag derivatives with CA changes both localize to the uropod but show low FRET. Color scale bar indicates colors associated with high (1) or low (0) FRET. E) Polarization indices were calculated for Fyn(10)/Gag-YFP and Fyn(10)/WMAA/Gag-YFP (see Materials and Methods). Three separate experiments (a total of 89 P2 cells for Fyn(10)/Gag-YFP and 78 P2 cells for Fyn(10)/WMAA/Gag-YFP) were used for quantification. Error bars represent standard deviation. P values were determined using Student's t test. NS, not significant.
Figure 11
Figure 11. Higher-order multimerization mediated by NC is required for Gag localization to the uropod.
A–C) P2 cells expressing Gag-YFP and Gag-CFP that contain an NC deletion or substitutions (green/blue) were immunostained with anti-α-tubulin (red, arrow indicates MTOC). Note that Fyn(10)/delNC/Gag-YFP/-CFP (A) and Fyn(10)/14A1G/Gag-YFP/-CFP (B) localize over the entire plasma membrane. Both mutants show reduced levels of FRET. In contrast, LZ/Gag-YFP/-CFP (C) mostly localizes to the uropod. High FRET is observed, indicating that multimerization is rescued as well. D) Polarization indices were calculated for LZ/Gag-YFP and Fyn(10)/14A1G/Gag-YFP and compared to WT Gag-YFP. LZ/Gag-YFP is less efficient in polarization, but significantly more efficient than Fyn(10)/14A1G/Gag-YFP. A total of 131 cells for Gag-YFP, 79 cells for LZ/Gag-YFP, and 69 cells for Fyn(10)/14A1G/Gag-YFP from three separate experiments were measured for polarized localization of Gag. Error bars represent standard deviation. P values were determined using Student's t test. *, P<0.05. ****, P<0.0001. E) and F) Double mutants containing the LZ sequence with the two different changes in the CA C-terminal domain, Fyn(10)/WMAA/LZ/Gag-YFP/-CFP (E) and Fyn(10)/delCA-CTD/LZ/Gag-YFP/-CFP (F), were expressed in P2 cells. Note that both Gag derivatives fail to localize to the uropod despite the presence of the LZ sequence.
Figure 12
Figure 12. Working model.
A) Based on the findings in this study, we have postulated a working model in which NC-mediated clustering of Gag allows association of Gag with uropod-specific microdomains that facilitate movement to the uropod in polarizing T cells. B) The virus-laden uropod, acting as a pre-formed platform that may either mediate contact with target cells (a) or relocalize to contacts formed elsewhere subsequently (b), constitutes a VS that facilitates cell-to-cell transmission of HIV-1.

Similar articles

Cited by

References

    1. Bajenoff M, Egen JG, Koo LY, Laugier JP, Brau F, et al. Stromal cell networks regulate lymphocyte entry, migration, and territoriality in lymph nodes. Immunity. 2006;25:989–1001. - PMC - PubMed
    1. Hugues S, Fetler L, Bonifaz L, Helft J, Amblard F, et al. Distinct T cell dynamics in lymph nodes during the induction of tolerance and immunity. Nat Immunol. 2004;5:1235–1242. - PubMed
    1. Mempel TR, Henrickson SE, Von Andrian UH. T-cell priming by dendritic cells in lymph nodes occurs in three distinct phases. Nature. 2004;427:154–159. - PubMed
    1. Miller MJ, Wei SH, Cahalan MD, Parker I. Autonomous T cell trafficking examined in vivo with intravital two-photon microscopy. Proc Natl Acad Sci U S A. 2003;100:2604–2609. - PMC - PubMed
    1. Miller MJ, Wei SH, Parker I, Cahalan MD. Two-photon imaging of lymphocyte motility and antigen response in intact lymph node. Science. 2002;296:1869–1873. - PubMed

Publication types

MeSH terms

Substances