. 2010 Oct 28;6(10):e1000970.
doi: 10.1371/journal.pcbi.1000970.

An automated phenotype-driven approach (GeneForce) for refining metabolic and regulatory models

Affiliations

An automated phenotype-driven approach (GeneForce) for refining metabolic and regulatory models

Dipak Barua et al. PLoS Comput Biol. .

Abstract

Integrated constraint-based metabolic and regulatory models can accurately predict cellular growth phenotypes arising from genetic and environmental perturbations. Challenges in constructing such models involve the limited availability of information about transcription factor--gene target interactions and computational methods to quickly refine models based on additional datasets. In this study, we developed an algorithm, GeneForce, to identify incorrect regulatory rules and gene-protein-reaction associations in integrated metabolic and regulatory models. We applied the algorithm to refine integrated models of Escherichia coli and Salmonella typhimurium, and experimentally validated some of the algorithm's suggested refinements. The adjusted E. coli model showed improved accuracy (∼80.0%) for predicting growth phenotypes for 50,557 cases (knockout mutants tested for growth in different environmental conditions). In addition to identifying needed model corrections, the algorithm was used to identify native E. coli genes that, if over-expressed, would allow E. coli to grow in new environments. We envision that this approach will enable the rapid development and assessment of genome-scale metabolic and regulatory network models for less characterized organisms, as such models can be constructed from genome annotations and cis-regulatory network predictions.


Conflict of interest statement

The authors have declared that no competing interests exist.

Figures
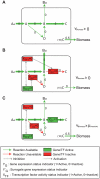
Figure 1
Figure 1. Example Network Illustrating the GeneForce Approach.
(A) Predicted fluxes through an un-regulated metabolic network, where all reactions are available (indicated by the green arrow) and flux through the biomass reaction (vBiomass) is maximized. The numbers and thickness of the arrows indicate flux values. (B) Predicted flux through an integrated metabolic and regulatory model (SR-FBA), where numbers and arrow thicknesses indicate flux values. The regulatory network includes regulation of two genes (G1 and G2) by two transcription factors (TF1 and TF2), where TF1 activates G1 and TF2 represses G2. G1 is needed for the B→C reaction and G2 is needed for the A→D reaction. Binary gene expression status (yG1 and yG2) and transcription factor activity (xTF1 and xTF2) indicators show the expression and binding status of G1, G2, TF1 and TF2, respectively, with value 1 indicating the expressed/active condition and 0 indicating the unexpressed/inactive condition. Regulatory interactions are shown as dashed lines, where a normal or blunt arrowhead indicates activation and repression, respectively. The colors indicate the state (active = green, inactive = red) of transcription factors and metabolic gene expression, or the availability of metabolic reactions (available = green, unavailable = red). (C) Fluxes and surrogate gene expression indicator values as predicted by the GeneForce approach. The reactions (B→C and A→D) are now dependent on the surrogate gene expression indicators (y′G1 and y′G2) instead of the expression status of genes G1 and G2 (yG1 and yG2). A threshold biomass flux (μthreshold) is set as a constraint and the GeneForce algorithm minimizes the sum of the differences between the surrogate gene expression indicators (shown in c) and the gene expression indicators (shown in b) while satisfying this constraint.
Figure 2
Figure 2. Accuracy and Number of Rule Correction Cases.
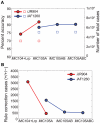
Application of GeneForce to correct growth phenotype predictions by overriding regulatory rules (A) Growth phenotype prediction accuracy of integrated regulatory-metabolic network models at various steps of regulatory network refinement. Accuracy (solid circles) is calculated by dividing total number of correct (experimentally consistent) predictions by the total number of cases evaluated (open squares) at each step. The colors correspond to the metabolic networks used in the integrated metabolic and regulatory network models with red for iJR904 and blue for iAF1260. (B) The total number of ‘rule correction’ cases (solid circles) for each regulatory network is plotted. Such cases are represented by +/+/− (Exp/Met/Met+Reg) in the growth comparison tables (Supporting Information Table S1 and S2).
Figure 3
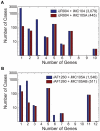
Figure 3. Number of Rule Corrections Needed to Correct Model Predictions.
Distribution of rule corrections for +/+/− cases before and after rule corrections for (A) iJR904 with rules from iMC104 (with Lrp modified regulatory rules) and iMC105A, and (B) iAF1260 with rules from iMC105A and iMC105AB. The total number of +/+/− cases for each integrated model is indicated in parenthesis in the legend. For each +/+/− case the minimum number of genes requiring regulatory rule corrections was determined. Panels A and B are histograms representing the number of cases where 1, 2, 3, 4, 5, 6, 7, 8, 9, 10, 11, or 12 genes need regulatory rule corrections.
Figure 4
Figure 4. Phenotyping Experiments to Confirm Rule Corrections.
Growth phenotype screens for (A) BW25113 (parent strain), lrp::kan ΔilvB, lrp::kan ΔilvN, lrp::kan ΔilvH, and lrp::kan ΔilvI on glucose M9 minimal media, (B) BW25113, lrp::kan, ΔdctA, and lrp::kan ΔdctA on L-malate M9 minimal media, (C) BW25113, ΔrpiA, ΔrpiB, and rpiA::kan ΔrpiB on D-ribose M9 minimal media, (D) BW25113, ΔrpiA, ΔrpiB, and rpiA::kan ΔrpiB on D-allose M9 minimal media, (E) BW25113, ΔcycA, ΔdsdX, and cycA::kan ΔdsdX on D-alanine M9 minimal media, and (F) BW25113, ΔcycA, ΔdsdX, and cycA::kan ΔdsdX on D-serine M9 minimal media.
Figure 5
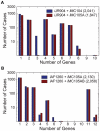
Figure 5. Number of Rule Corrections Needed to Rescue Non-Growth Phenotypes.
Distribution of ‘rescue non-growth’ (−/+/−) cases before and after rule corrections for (A) iJR904 with rules from the iMC104 (with Lrp modified regulatory rules) and iMC105A, and (B) iAF1260 with rules from iMC105A and iMC105AB. The number in parenthesis in the legends indicates the total number of (−/+/−) cases for the different integrated models. For each −/+/− case on the minimum number of genes requiring regulatory rule violations was determined. Panels a and b are histograms representing the number of cases requiring 1, 2, 3, 4, 5, 6, 7, 8, 9, 10, 11, or 12 genes to be overexpressed to rescue non-growth phenotypes.

References

    1. Herrgard MJ, Covert MW, Palsson BO. Reconstruction of microbial transcriptional regulatory networks. Curr Opin Biotechnol. 2004;15:70–77. - PubMed
    1. Venancio T, Aravind L. Reconstructing prokaryotic transcriptional regulatory networks: lessons from actinobacteria. J Biol. 2009;8:29. - PMC - PubMed
    1. Covert MW, Knight EM, Reed JL, Herrgard MJ, Palsson BO. Integrating high-throughput and computational data elucidates bacterial networks. Nature. 2004;429:92–96. - PubMed
    1. Herrgard MJ, Lee BS, Portnoy V, Palsson BO. Integrated analysis of regulatory and metabolic networks reveals novel regulatory mechanisms in Saccharomyces cerevisiae. Genome Res. 2006;16:627–635. - PMC - PubMed
    1. Feist AM, Herrgard MJ, Thiele I, Reed JL, Palsson BO. Reconstruction of biochemical networks in microorganisms. Nat Rev Microbiol. 2009;7:129–143. - PMC - PubMed

Publication types