

Role of lipids in spheroidal high density lipoproteins
- PMID: 21060857
- PMCID: PMC2965744
- DOI: 10.1371/journal.pcbi.1000964
Role of lipids in spheroidal high density lipoproteins
Abstract
We study the structure and dynamics of spherical high density lipoprotein (HDL) particles through coarse-grained multi-microsecond molecular dynamics simulations. We simulate both a lipid droplet without the apolipoprotein A-I (apoA-I) and the full HDL particle including two apoA-I molecules surrounding the lipid compartment. The present models are the first ones among computational studies where the size and lipid composition of HDL are realistic, corresponding to human serum HDL. We focus on the role of lipids in HDL structure and dynamics. Particular attention is paid to the assembly of lipids and the influence of lipid-protein interactions on HDL properties. We find that the properties of lipids depend significantly on their location in the particle (core, intermediate region, surface). Unlike the hydrophobic core, the intermediate and surface regions are characterized by prominent conformational lipid order. Yet, not only the conformations but also the dynamics of lipids are found to be distinctly different in the different regions of HDL, highlighting the importance of dynamics in considering the functionalization of HDL. The structure of the lipid droplet close to the HDL-water interface is altered by the presence of apoA-Is, with most prominent changes being observed for cholesterol and polar lipids. For cholesterol, slow trafficking between the surface layer and the regimes underneath is observed. The lipid-protein interactions are strongest for cholesterol, in particular its interaction with hydrophobic residues of apoA-I. Our results reveal that not only hydrophobicity but also conformational entropy of the molecules are the driving forces in the formation of HDL structure. The results provide the first detailed structural model for HDL and its dynamics with and without apoA-I, and indicate how the interplay and competition between entropy and detailed interactions may be used in nanoparticle and drug design through self-assembly.
Conflict of interest statement
The authors have declared that no competing interests exist.
Figures
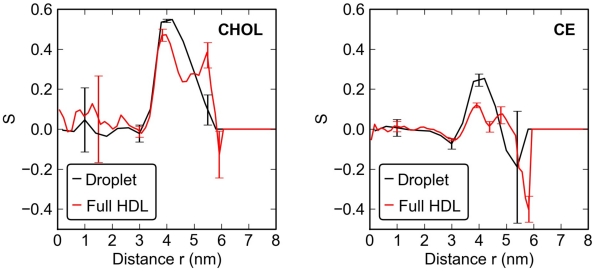
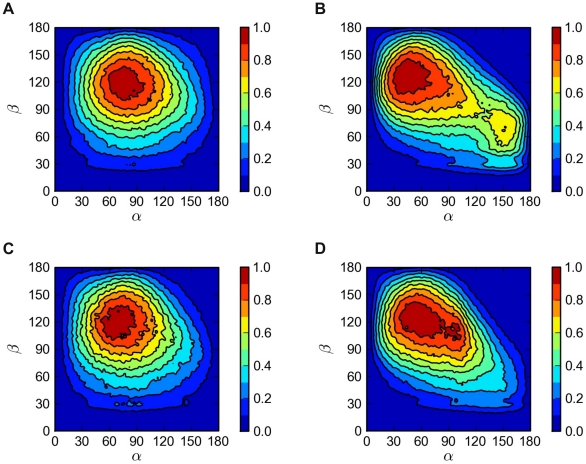
 between the CE ring and the effective normal of the lipid droplet. The vertical axis is the angle
  between the ring structure and the oleate chain. The left panels (A, C) describe the core of the droplet (
 nm) and the right panels (B, D) the surface (
 nm). The pictures at the top (A, B) show the lipid droplet without apoA-I and those at the bottom (C, D) the full HDL.
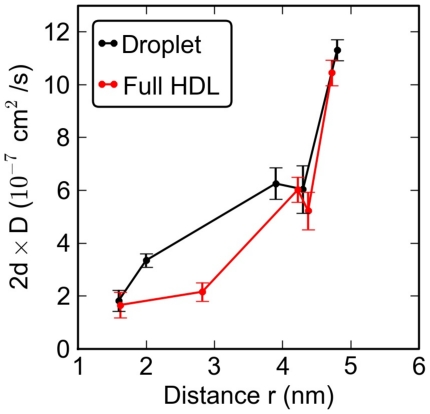
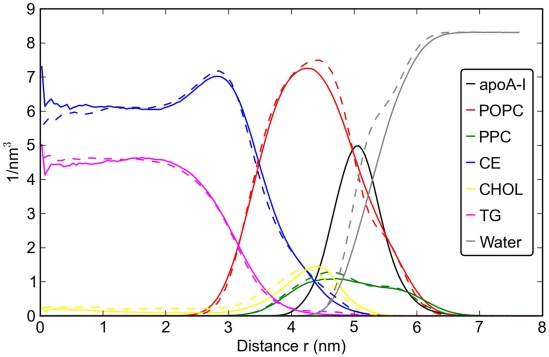
 is the average distance of the given lipid from the COM of the particle. To facilitate comparison between core (three-dimensional diffusion) and surface lipids (two-dimensional diffusion), the coefficients have been scaled with
  , where
  is the dimension of the fit (either two or three).
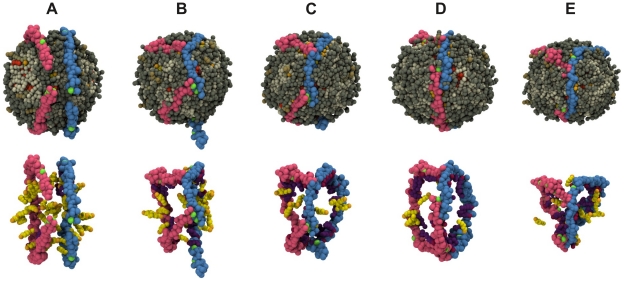
 s, (B) 0.4
  s, (C) 1.4
  s, (D) 12.4
  s, and (E) 19.04
  s. (Bottom) Snapshots displayed at the top of the figure showing here only the apoA-I molecules, and annular and bulk CHOL molecules. The two apoA-I chains are in light red (chain A) and light blue (chain B) with proline residues in green. Annular CHOL molecules are shown in purple with a dark red hydroxyl group. Bulk CHOL molecules are depicted in yellow with an orange hydroxyl group.
Similar articles
-
Computational studies of plasma lipoprotein lipids.Biochim Biophys Acta. 2016 Oct;1858(10):2401-2420. doi: 10.1016/j.bbamem.2016.03.010. Epub 2016 Mar 9. Biochim Biophys Acta. 2016. PMID: 26969087
-
An atomistic characterization of high-density lipoproteins and the conserved "LN" region of apoA-I.Biophys J. 2024 May 7;123(9):1116-1128. doi: 10.1016/j.bpj.2024.03.039. Epub 2024 Mar 29. Biophys J. 2024. PMID: 38555508 Free PMC article.
-
Dynamics of activation of lecithin:cholesterol acyltransferase by apolipoprotein A-I.Biochemistry. 2009 Dec 1;48(47):11196-210. doi: 10.1021/bi901242k. Biochemistry. 2009. PMID: 19860440 Free PMC article.
-
Significance of Lipid-Free and Lipid-Associated ApoA-I in Cellular Cho-lesterol Efflux.Curr Protein Pept Sci. 2017;18(1):92-99. doi: 10.2174/1389203717666160713150223. Curr Protein Pept Sci. 2017. PMID: 27412400 Review.
-
Structural studies of discoidal lipoprotein A-I.Cell Mol Life Sci. 2001 Jun;58(7):885-93. doi: 10.1007/PL00000908. Cell Mol Life Sci. 2001. PMID: 11497237 Free PMC article. Review.
Cited by
-
Lipid exchange mechanism of the cholesteryl ester transfer protein clarified by atomistic and coarse-grained simulations.PLoS Comput Biol. 2012 Jan;8(1):e1002299. doi: 10.1371/journal.pcbi.1002299. Epub 2012 Jan 12. PLoS Comput Biol. 2012. PMID: 22253581 Free PMC article.
-
Study of trioleoylglycerol two-layer and adiposome cross-section mimicking four-layer systems through atomic-level simulations.Struct Dyn. 2022 Dec 5;9(6):064701. doi: 10.1063/4.0000168. eCollection 2022 Nov. Struct Dyn. 2022. PMID: 36484071 Free PMC article.
-
Multiscale Simulations of Biological Membranes: The Challenge To Understand Biological Phenomena in a Living Substance.Chem Rev. 2019 May 8;119(9):5607-5774. doi: 10.1021/acs.chemrev.8b00538. Epub 2019 Mar 12. Chem Rev. 2019. PMID: 30859819 Free PMC article.
-
Interfacial properties of high-density lipoprotein-like lipid droplets with different lipid and apolipoprotein A-I compositions.Biophys J. 2013 May 21;104(10):2193-201. doi: 10.1016/j.bpj.2013.02.058. Biophys J. 2013. PMID: 23708359 Free PMC article.
-
Conformational and aggregation properties of the 1-93 fragment of apolipoprotein A-I.Protein Sci. 2014 Nov;23(11):1559-71. doi: 10.1002/pro.2534. Epub 2014 Aug 23. Protein Sci. 2014. PMID: 25131953 Free PMC article.
References
-
- Mokdad AH, Marks JS, Stroup DF, Gerberding JL. Actual causes of death in the United States, 2000. JAMA. 2004;291:1238–1245. - PubMed
-
- Castelli WP, Garrison RJ, Wilson PW, Abbott RD, Kalousdian S, et al. Incidence of coronary heart disease and lipoprotein cholesterol levels. The Framingham Study. JAMA. 1986;256:2835–2838. - PubMed
-
- Hevonoja T, Pentikäinen MO, Hyvönen MT, Kovanen PT, Ala-Korpela M. Structure of low density lipoprotein (LDL) particles: Basis for understanding molecular changes in modified LDL. Biochim Biophys Acta. 2000;1488:189–210. - PubMed
-
- Colvin PL, Parks JS. Metabolism of high density lipoprotein subfractions. Curr Opin Lipidol. 1999;10:309–314. - PubMed
-
- Linsel-Nitschke P, Tall AR. HDL as a target in the treatment of atherosclerotic cardiovascular disease. Nat Rev Drug Discov. 2005;4:193–205. - PubMed
Publication types
MeSH terms
Substances
LinkOut - more resources
Full Text Sources
