

Misregulated E-cadherin expression associated with an aggressive brain tumor phenotype
- PMID: 21060868
- PMCID: PMC2965143
- DOI: 10.1371/journal.pone.0013665
Misregulated E-cadherin expression associated with an aggressive brain tumor phenotype
Abstract
Background: Cadherins are essential components of the adherens junction complexes that mediate cell-cell adhesion and regulate cell motility. During tissue morphogenesis, changes in cadherin expression (known as cadherin switching) are a common mechanism for altering cell fate. Cadherin switching is also common during epithelial tumor progression, where it is thought to promote tumor invasion and metastasis. E-cadherin is the predominant cadherin expressed in epithelial tissues, but its expression is very limited in normal brain.
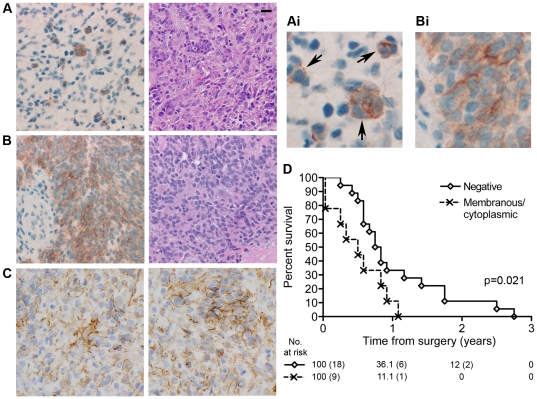
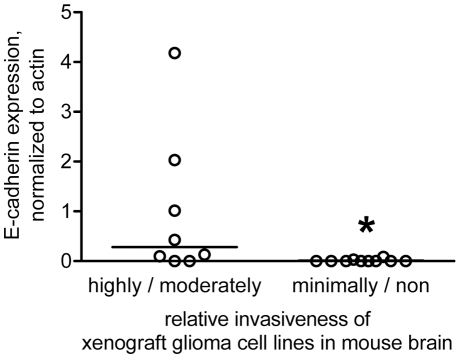
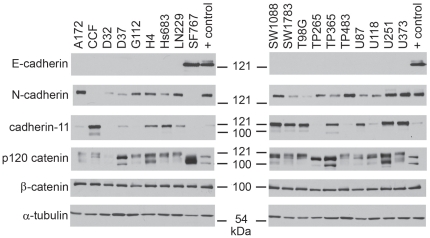
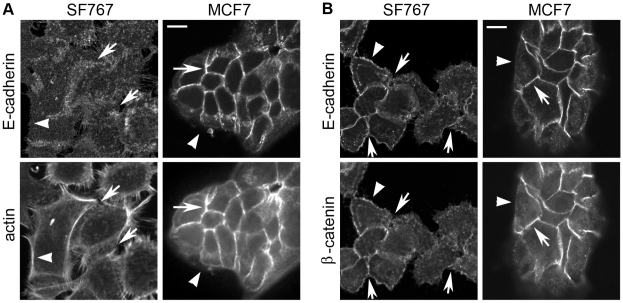
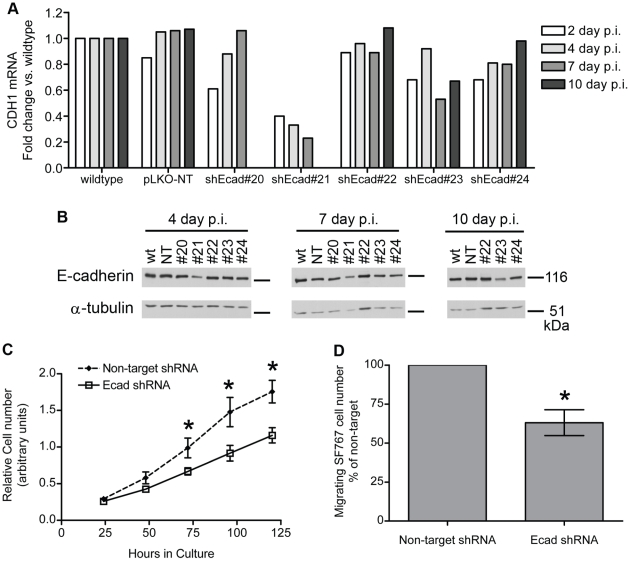
Methodology/principal findings: We identified E-cadherin expression in a retrospective series of glioblastomas exhibiting epithelial or pseudoepithelial differentiation. Unlike in epithelial tissues, E-cadherin expression in gliomas correlated with an unfavorable clinical outcome. Western blotting of two panels of human GBM cell lines propagated either as xenografts in nude mice or grown under conventional cell culture conditions confirmed that E-cadherin expression is rare. However, a small number of xenograft lines did express E-cadherin, its expression correlating with increased invasiveness when the cells were implanted orthotopically in mouse brain. In the conventionally cultured SF767 glioma cell line, E-cadherin expression was localized throughout the plasma membrane rather than being restricted to areas of cell-cell contact. ShRNA knockdown of E-cadherin in these cells resulted in decreased proliferation and migration in vitro.
Conclusions/significance: Our data shows an unexpected correlation between the abnormal expression of E-cadherin in a subset of GBM tumor cells and the growth and migration of this aggressive brain tumor subtype.
Conflict of interest statement
Figures

Similar articles
-
Cadherin-11, a marker of the mesenchymal phenotype, regulates glioblastoma cell migration and survival in vivo.Mol Cancer Res. 2012 Mar;10(3):293-304. doi: 10.1158/1541-7786.MCR-11-0457. Epub 2012 Jan 20. Mol Cancer Res. 2012. PMID: 22267545 Free PMC article.
-
Slug regulates proliferation and invasiveness of esophageal adenocarcinoma cells in vitro and in vivo.Med Oncol. 2011 Dec;28(4):1089-100. doi: 10.1007/s12032-010-9652-7. Epub 2010 Aug 21. Med Oncol. 2011. PMID: 20730573
-
Radixin knockdown by RNA interference suppresses human glioblastoma cell growth in vitro and in vivo.Asian Pac J Cancer Prev. 2014;15(22):9805-12. doi: 10.7314/apjcp.2014.15.22.9805. Asian Pac J Cancer Prev. 2014. PMID: 25520109
-
BMP4 inhibits glioblastoma invasion by promoting E-cadherin and claudin expression.Front Biosci (Landmark Ed). 2019 Mar 1;24(6):1060-1070. doi: 10.2741/4768. Front Biosci (Landmark Ed). 2019. PMID: 30844730
-
Correlation of N-cadherin expression in high grade gliomas with tissue invasion.J Neurooncol. 2004 Oct;70(1):3-15. doi: 10.1023/b:neon.0000040811.14908.f2. J Neurooncol. 2004. PMID: 15527101
Cited by
-
Adhesion in mammary development: novel roles for E-cadherin in individual and collective cell migration.Curr Top Dev Biol. 2015;112:353-82. doi: 10.1016/bs.ctdb.2014.12.001. Epub 2015 Feb 11. Curr Top Dev Biol. 2015. PMID: 25733146 Free PMC article. Review.
-
Cellular-based immunotherapies for patients with glioblastoma multiforme.Clin Dev Immunol. 2012;2012:764213. doi: 10.1155/2012/764213. Epub 2012 Feb 28. Clin Dev Immunol. 2012. PMID: 22474481 Free PMC article. Review.
-
Network Modeling Identifies Patient-specific Pathways in Glioblastoma.Sci Rep. 2016 Jun 29;6:28668. doi: 10.1038/srep28668. Sci Rep. 2016. PMID: 27354287 Free PMC article.
-
Cofilin Acts as a Booster for Progression of Malignant Tumors Represented by Glioma.Cancer Manag Res. 2022 Nov 24;14:3245-3269. doi: 10.2147/CMAR.S389825. eCollection 2022. Cancer Manag Res. 2022. PMID: 36452435 Free PMC article. Review.
-
Boehmeria Nivea Extract (BNE-RRC) Reverses Epithelial-Mesenchymal Transition and Inhibits Anchorage-Independent Growth in Tumor Cells.Int J Mol Sci. 2024 Sep 4;25(17):9572. doi: 10.3390/ijms25179572. Int J Mol Sci. 2024. PMID: 39273519 Free PMC article.
References
-
- Giese A, Bjerkvig R, Berens ME, Westphal M. Cost of migration: invasion of malignant gliomas and implications for treatment. J Clin Oncol. 2003;21:1624–1636. - PubMed
-
- Takeichi M. Cadherins in cancer: implications for invasion and metastasis. Curr Opin Cell Biol. 1993;5:806–811. - PubMed
-
- Takeichi M. Morphogenetic roles of classic cadherins. Curr Opin Cell Biol. 1995;7:619–627. - PubMed
Publication types
MeSH terms
Substances
Grants and funding
LinkOut - more resources
Full Text Sources
Other Literature Sources
Medical
