

Global analysis of circulating immune cells by matrix-assisted laser desorption ionization time-of-flight mass spectrometry
- PMID: 21060873
- PMCID: PMC2965159
- DOI: 10.1371/journal.pone.0013691
Global analysis of circulating immune cells by matrix-assisted laser desorption ionization time-of-flight mass spectrometry
Abstract
Background: MALDI-TOF mass spectrometry is currently used in microbiological diagnosis to characterize bacterial populations. Our aim was to determine whether this technique could be applied to intact eukaryotic cells, and in particular, to cells involved in the immune response.
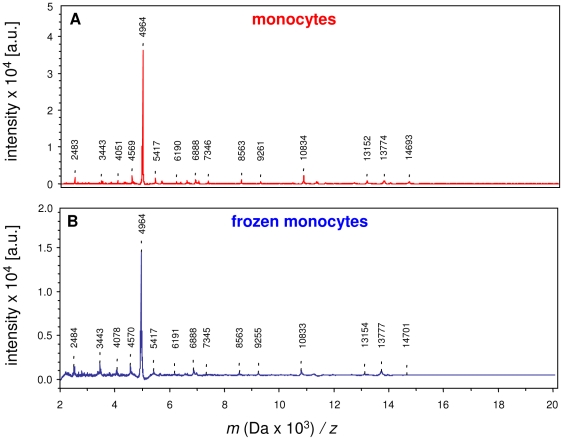
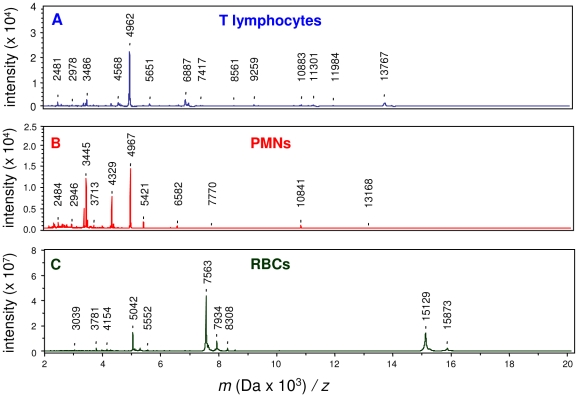
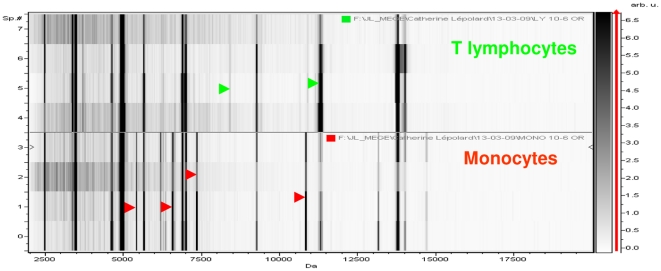
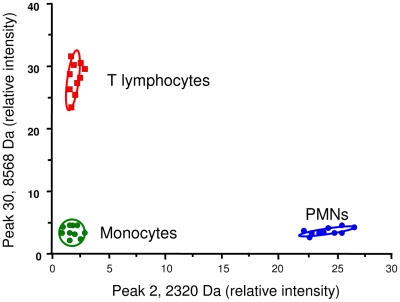
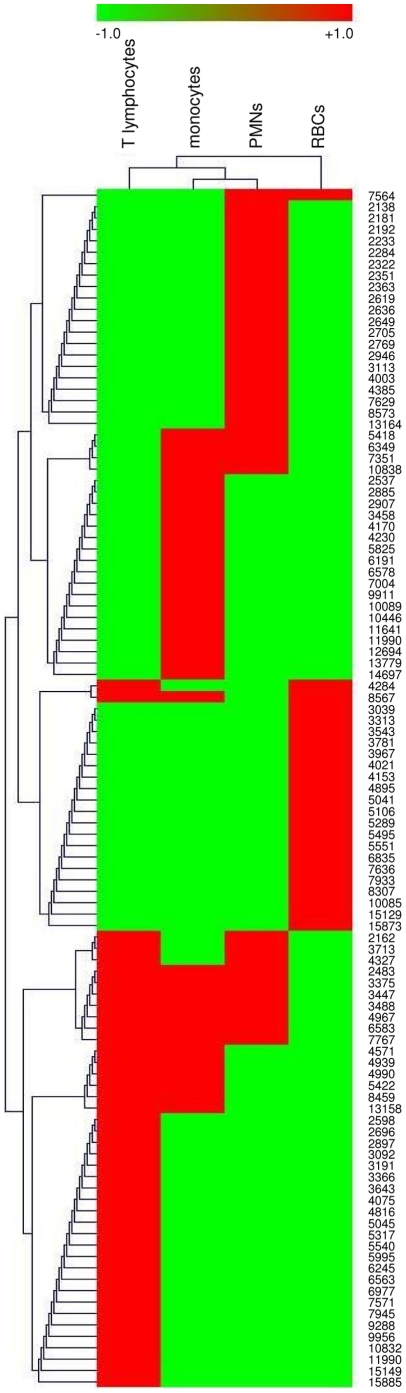
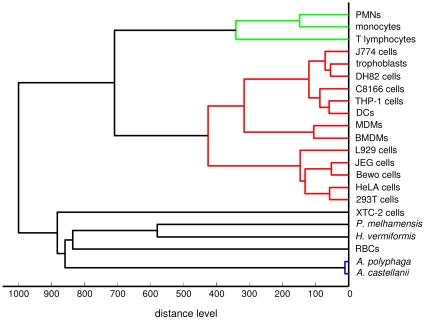
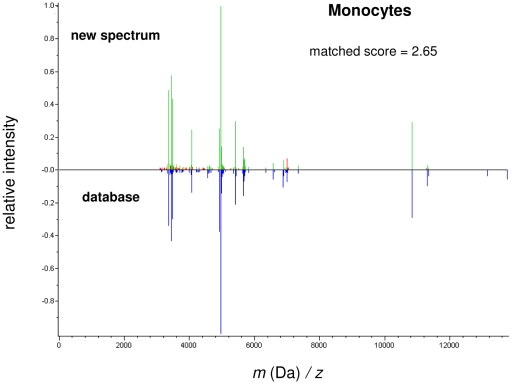
Methodology/principal findings: A comparison of frozen monocytes, T lymphocytes and polymorphonuclear leukocytes revealed specific peak profiles. We also found that twenty cell types had specific profiles, permitting the establishment of a cell database. The circulating immune cells, namely monocytes, T lymphocytes and polymorphonuclear cells, were distinct from tissue immune cells such as monocyte-derived macrophages and dendritic cells. In addition, MALDI-TOF mass spectrometry was valuable to easily identify the signatures of monocytes and T lymphocytes in peripheral mononuclear cells.
Conclusions/significance: This method was rapid and easy to perform, and unlike flow cytometry, it did not require any additional components such as specific antibodies. The MALDI-TOF mass spectrometry approach could be extended to analyze the cell composition of tissues and the activation state of immune cells.
Conflict of interest statement
Figures
Similar articles
-
Analysis and Characterization of Immune Cells and Their Activation Status by Whole-Cell MALDI-TOF Mass Spectrometry.Methods Mol Biol. 2019;2024:339-351. doi: 10.1007/978-1-4939-9597-4_23. Methods Mol Biol. 2019. PMID: 31364062
-
Whole-cell MALDI-TOF mass spectrometry: a tool for immune cell analysis and characterization.Methods Mol Biol. 2013;1061:197-209. doi: 10.1007/978-1-62703-589-7_12. Methods Mol Biol. 2013. PMID: 23963939
-
A New Method Aimed to Quickly Identify Pathogen and Drug Susceptibility Test Based on Matrix-Assisted Laser Desorption/Ionization Time of Flight Mass Spectrometry Combined with Flow Cytometry.Surg Infect (Larchmt). 2019 Apr;20(3):219-224. doi: 10.1089/sur.2018.145. Epub 2019 Jan 18. Surg Infect (Larchmt). 2019. PMID: 30657423
-
Current Status of Matrix-Assisted Laser Desorption/Ionization-Time-of-Flight Mass Spectrometry (MALDI-TOF MS) in Clinical Diagnostic Microbiology.Molecules. 2020 Oct 17;25(20):4775. doi: 10.3390/molecules25204775. Molecules. 2020. PMID: 33080897 Free PMC article. Review.
-
Matrix assisted laser desorption time of flight mass spectrometry (MALDI-TOF MS) in clinical microbiology.J Microbiol Methods. 2017 Jul;138:20-29. doi: 10.1016/j.mimet.2016.09.003. Epub 2016 Sep 6. J Microbiol Methods. 2017. PMID: 27613479 Review.
Cited by
-
Classification of ancient mammal individuals using dental pulp MALDI-TOF MS peptide profiling.PLoS One. 2011 Feb 25;6(2):e17319. doi: 10.1371/journal.pone.0017319. PLoS One. 2011. PMID: 21364886 Free PMC article.
-
Ratiometric Mass Spectrometry for Cell Identification and Quantitation Using Intracellular "Dual-Biomarkers".Sci Rep. 2017 Dec 12;7(1):17432. doi: 10.1038/s41598-017-17812-1. Sci Rep. 2017. PMID: 29234137 Free PMC article.
-
Rapid and robust MALDI-TOF MS techniques for microbial identification: a brief overview of their diverse applications.J Microbiol. 2018 Apr;56(4):209-216. doi: 10.1007/s12275-018-7457-0. Epub 2018 Feb 28. J Microbiol. 2018. PMID: 29492868 Review.
-
Identification of Tsetse (Glossina spp.) using matrix-assisted laser desorption/ionisation time of flight mass spectrometry.PLoS Negl Trop Dis. 2013 Jul 11;7(7):e2305. doi: 10.1371/journal.pntd.0002305. Print 2013. PLoS Negl Trop Dis. 2013. PMID: 23875040 Free PMC article.
-
MALDI-TOF MS and point of care are disruptive diagnostic tools in Africa.New Microbes New Infect. 2018 Sep 7;26:S83-S88. doi: 10.1016/j.nmni.2018.08.020. eCollection 2018 Nov. New Microbes New Infect. 2018. PMID: 30402248 Free PMC article.
References
-
- Lehtonen A, Ahlfors H, Veckman V, Miettinen M, Lahesmaa R, et al. Gene expression profiling during differentiation of human monocytes to macrophages or dendritic cells. J Leukoc Biol. 2007;82:710–720. - PubMed
-
- Consortium, C. H. L. P. P. First insight into the human liver proteome from PROTEOME(SKY)-LIVER(Hu) 1.0, a Publicly available database. J Proteome Res. 2010;9:79–94. - PubMed
-
- Dupont A, Tokarski C, Dekeyzer O, Guihot AL, et al. Two-dimensional maps and databases of the human macrophage proteome and secretome. Proteomics 2004. 2004;4:1761–1778. - PubMed
-
- Srisomsap C, Sawangareetrakul P, Subhasitanont P, Panichakul T, Keeratichamroen S, et al. Proteomic analysis of cholangiocarcinoma cell line. Proteomics. 2004;4:1135–1144. - PubMed
Publication types
MeSH terms
LinkOut - more resources
Full Text Sources
Other Literature Sources
