Comparative Study
. 2010 Oct 28;5(10):e13701.
doi: 10.1371/journal.pone.0013701.

Comparing brain networks of different size and connectivity density using graph theory

Affiliations
Comparative Study

Comparing brain networks of different size and connectivity density using graph theory

Bernadette C M van Wijk et al. PLoS One. .

Abstract

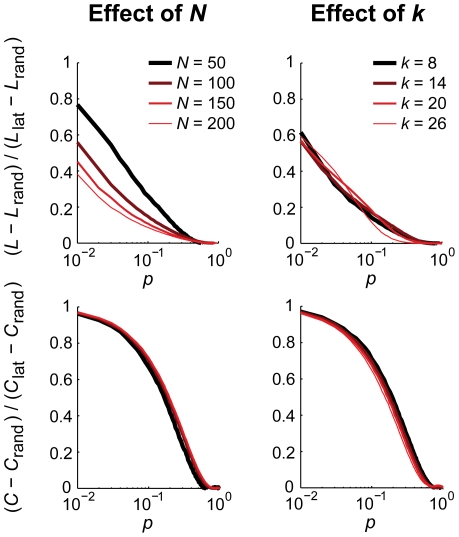
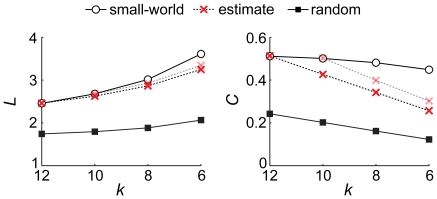
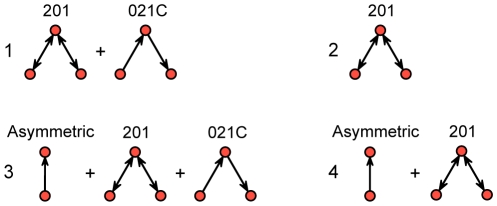
Graph theory is a valuable framework to study the organization of functional and anatomical connections in the brain. Its use for comparing network topologies, however, is not without difficulties. Graph measures may be influenced by the number of nodes (N) and the average degree (k) of the network. The explicit form of that influence depends on the type of network topology, which is usually unknown for experimental data. Direct comparisons of graph measures between empirical networks with different N and/or k can therefore yield spurious results. We list benefits and pitfalls of various approaches that intend to overcome these difficulties. We discuss the initial graph definition of unweighted graphs via fixed thresholds, average degrees or edge densities, and the use of weighted graphs. For instance, choosing a threshold to fix N and k does eliminate size and density effects but may lead to modifications of the network by enforcing (ignoring) non-significant (significant) connections. Opposed to fixing N and k, graph measures are often normalized via random surrogates but, in fact, this may even increase the sensitivity to differences in N and k for the commonly used clustering coefficient and small-world index. To avoid such a bias we tried to estimate the N,k-dependence for empirical networks, which can serve to correct for size effects, if successful. We also add a number of methods used in social sciences that build on statistics of local network structures including exponential random graph models and motif counting. We show that none of the here-investigated methods allows for a reliable and fully unbiased comparison, but some perform better than others.


Conflict of interest statement

Competing Interests: The authors have declared that no competing interests exist.

Figures

Figure 1
Figure 1. Differences in average degree between empirical networks may influence graph measures.
The data here are taken from an MEG experiment we conducted in which participants performed a precision grip force in six experimental conditions that differed in the force pattern exerted (static or dynamic) and hand used (left, right, or bimanual). The topographies show the relative phase uniformity (15–30Hz) between all MEG sensor combinations that is increased compared to resting state. The gray scale indicates the connectivity strength, with stronger connections in darker colors. Results are averaged over 3×40s steady state force production and 20 participants. Lower panels: although the clustering coefficient (C) and path length (L) show clear differences between conditions, these effects co-vary with differences in average degree (k). This can be seen more clearly in the right plot where values are divided by the average for each measure and L is inverted. It is difficult to disentangle true experimental effects from those introduced by differences in k because the exact dependence of C and L on k is unknown.
Figure 2
Figure 2. Imposing a fixed average degree can modify network structure.
Applying a variable threshold to obtain a fixed average degree (k) may have consequences for the resulting network structure. A relatively large average degree for a network with low overall connectivity will convert non-significant values into edges. By contrast, a relatively small k for a network with high overall connectivity will omit a number of significant connections. Connectivity strength is indicated using a gray scale with black indicating strong (significant) connections.
Figure 3
Figure 3. Normalized graph measures using random surrogates remain sensitive to network size and average degree.
Path length (L) and clustering coefficient (C) normalized by dividing values from a lattice and small-world network (rewiring probability = 0.1) by those of random networks still depend on the network's number of nodes (N) and average degree (k) because their curves as function of N and k are specific for each type of network. Small-world networks (sw) fall in between lattices (lat) and random networks (r) and so the influence of normalization on the N,k-dependence is smaller compared to lattices. Since L for small-world networks is close to that of random networks, normalization improves the independence of N and k (more horizontal curves). By contrast, C is close to that of lattices and normalization introduces a bias that is larger compared to the non-normalized measure. Because of this, the small-world index (SW) is also greatly affected by N and k. There is little to no difference for Erdös-Rényi networks and random networks with the same degree distribution as the original network (lat-r, sw-r) and even coincide for L. The legend for SW indicates between brackets the type of random surrogates used in the calculation. A: Effects of changes in the number of nodes (N) while keeping the average degree constant (k = 10). B: Effects of changes in the average degree (k) while keeping the number of nodes constant (N = 100). C: Effects of changes in the number of nodes while keeping the edge density constant (0.1). Note that k now increases with network size. In this case, the sensitivity to network size is greatly reduced.
Figure 4
Figure 4. The sensitivity of small-world networks to size and average degree changes depends on rewiring probability.
The dependence for normalized path length and clustering coefficient (L/L rand and C/C rand with Erdös-Rényi random networks) decreases with rewiring probability p (stronger resemblance to random networks). A: Effects of changes in the number of nodes (N) while keeping the average degree constant (k = 10). B: Effects of changes in the average degree (k) while keeping the number of nodes constant (N = 100).
Figure 5
Figure 5. Normalization of graph measures by the range of possible values.
Expressing path length (L) and clustering coefficient (C) as a ratio of the range of obtainable values (lattice - random) diminishes the sensitivity to changes in number of nodes N and average degree k. Only the path length remains largely sensitive to changes in N for a large range of rewiring probabilities p (the four curves do not coincide here). Shown are small-world networks with either a fixed k = 10 or a fixed N = 100.
Figure 6
Figure 6. The random removal of edges introduces a bias towards random networks.
Shown here is the estimation of the k-dependence for a small-world network (rewiring probability = 0.1). Edges were stepwise randomly removed from the original network and the path length (L) and clustering coefficient (C) were recalculated. This procedure was repeated 200 times, resulting in an average k-dependence estimate. We started this estimation both with a original network having k = 10 (dashed black line) and k = 12 dashed grey line). Estimates showed a deviation from the simulated k-dependence of the small-world network and depended on the average degree of the original network. Effects were smaller for L compared to C since values are already closer to those for random networks.
Figure 7
Figure 7. Graphical representation of our four exponential random graph models.
The triads are given conventional numbering; see Figure S4 for a complete overview of all possible dyads and triads.

References

    1. Watts DJ, Strogatz SH. Collective dynamics of ‘small-world’ networks. Nature. 1998;393:440–442. - PubMed
    1. Barabási AL, Albert R. Emergence of scaling in random networks. Science. 1999;286:509–512. - PubMed
    1. Sporns O, Zwi JD. The small world of the cerebral cortex. Neuroinformatics. 2004;2:145–162. - PubMed
    1. He Y, Chen ZJ, Evans AC. Small-world anatomical networks in the human brain revealed by cortical thickness from MRI. Cereb Cortex. 2007;17:2407–2419. - PubMed
    1. Chen ZJ, He Y, Rosa-Neto P, Germann J, Evans AC. Revealing modular architecture of human brain structural networks by using cortical thickness from MRI. Cereb Cortex. 2008;18:2374–2381. - PMC - PubMed

Publication types