. 2010;15(1):27-42.
doi: 10.3727/105221610x12819686555097.

Early transcriptional events during osteogenic differentiation of human bone marrow stromal cells induced by Lim mineralization protein 3

Affiliations

Early transcriptional events during osteogenic differentiation of human bone marrow stromal cells induced by Lim mineralization protein 3

Camilla Bernardini et al. Gene Expr. 2010.

Abstract

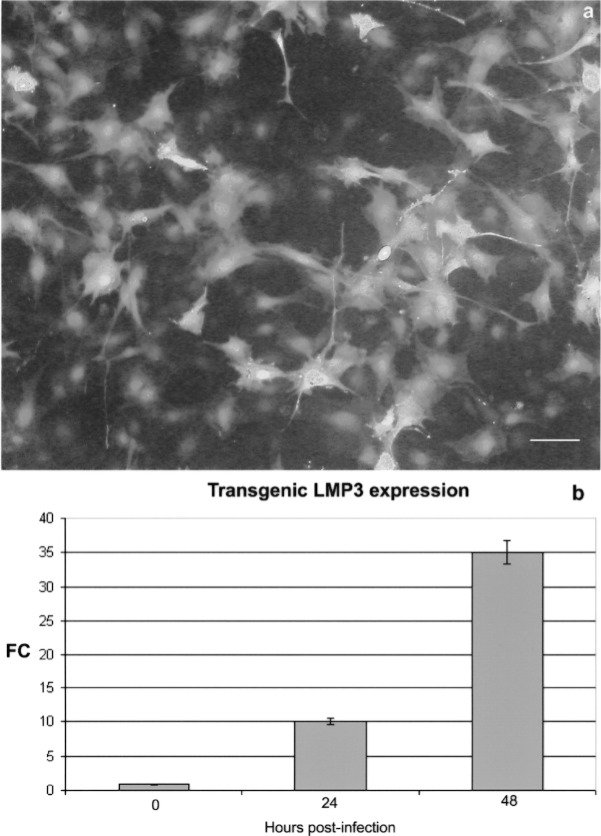
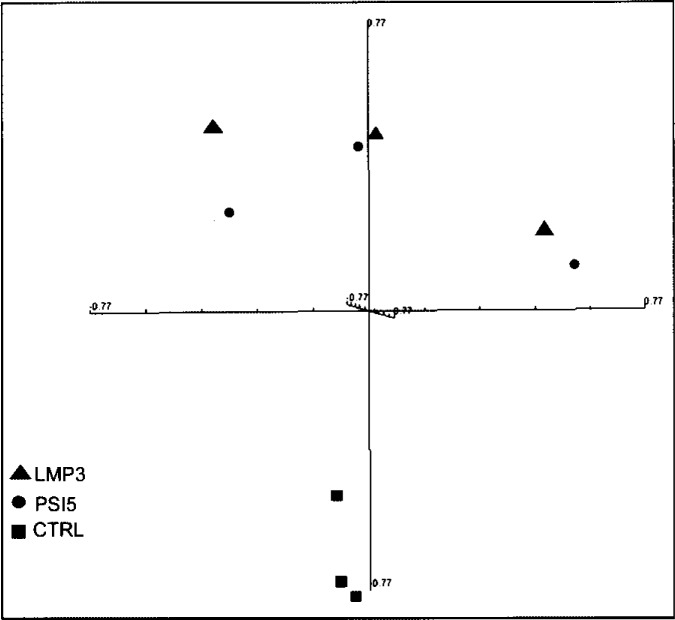
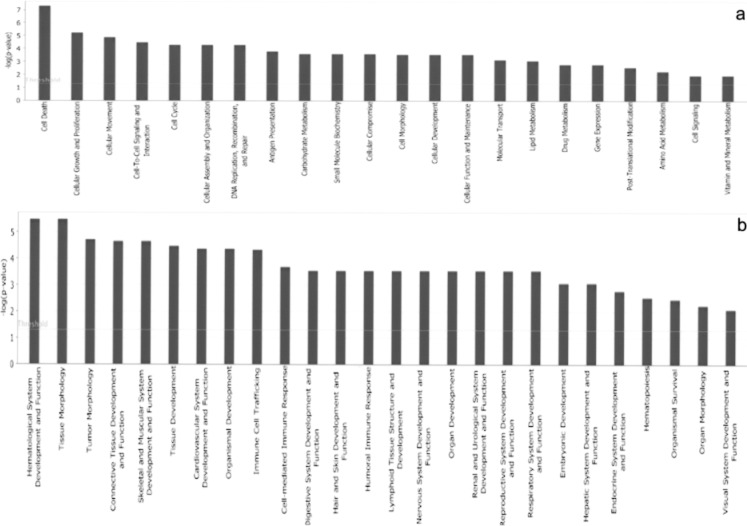
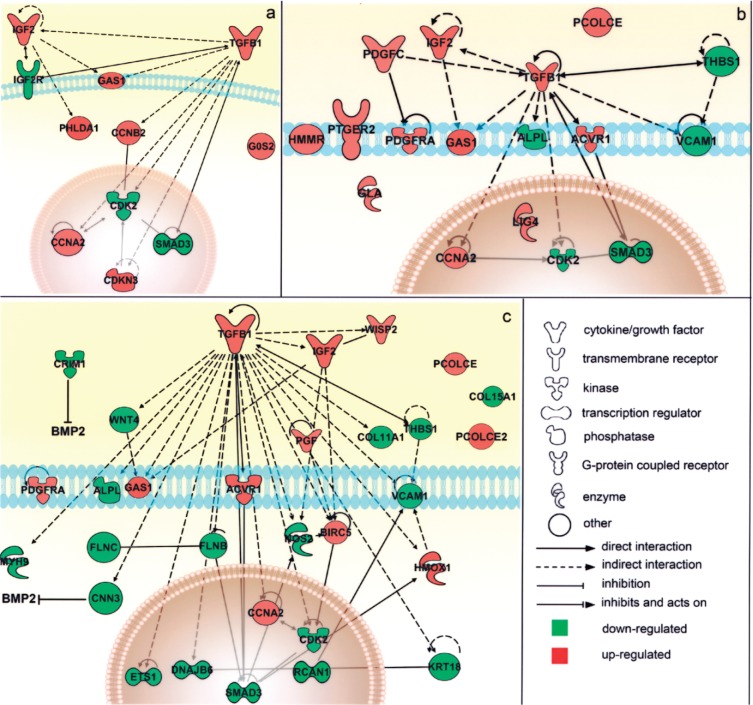
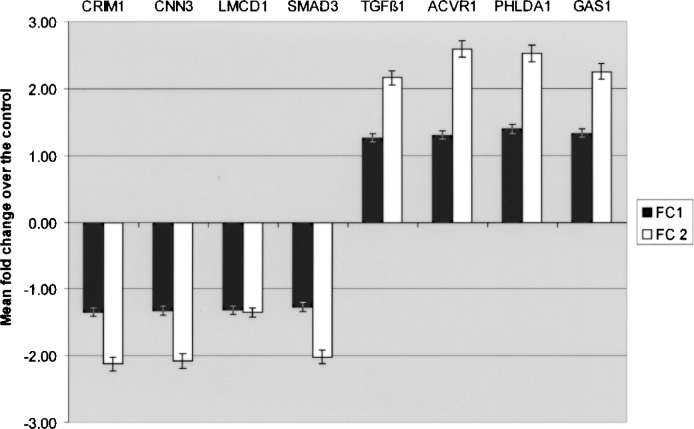
Lim mineralization protein-3 (LMP3) induces osteoblast differentiation by regulating the expression and activity of certain molecules involved in the osteogenic cascade, including those belonging to the bone morphogenetic protein (BMP) family. The complete network of molecular events involved in LMP3-mediated osteogenesis is still unknown. The aim of this study was to analyze the genome-wide gene expression profiles in human mesenchymal stem cells (hMSC) induced by exogenous LMP3 to mediate osteogenesis. For this purpose hMSC were transduced with a defective adenoviral vector expressing the human LMP3 gene and microarray analysis was performed 1 day post-adenoviral transduction. Cells transduced with the vector backbone and untransduced cells were used as independent controls in the experiments. Microarray data were independently validated by means of real-time PCR on selected transcripts. The statistical analysis of microarray data produced a list of 263 significantly (p < 0.01) differentially expressed transcripts. The biological interpretation of the results indicated, among the most noteworthy effects, the modulation of genes involved in the TGF-beta1 pathway: 88 genes coding for key regulators of the cell cycle regulatory machinery and 28 genes implicated in the regulation of cell proliferation along with the development of connective, muscular, and skeletal tissues. These results suggested that LMP3 could affect the fine balance between cell proliferation/differentiation of mesenchymal cells mostly by modulating the TGF-beta1 signaling pathway.


Figures

Figure 1
Figure 1
Endogenous LMP gene expression in untransduced cells. The expression of the endogenous LMP gene was assessed in untransduced hMSC, cultured for 0 (TO), 2 (T2), and 4(T4) days in osteogenic medium, by means of RT-PCR. LMP1 is expressed at higher levels in undifferentiated hMSC and during osteogenic induction. LMP3 expression in undifferentiated cells (TO) is barely detectable.
Figure 2
Figure 2
Adenoviral-mediated transduction efficiency. hMSC were infected using a replication-defective adenoviral vectors carrying either the human LMP3 or the EGFP gene; the adenoviral vector backbone (Adψ5) served as control. (a) EGFP served as a reporter gene, which allowed to assess the transgene expression in vitro by counting EGFP-positive cells under fluorescent invertoscope 24 h after transduction. Scale bar: 10 μm. (b) Transgenic LMP3 expression was assessed in AdLMP3-transduced cells by means of real-time PCR in time course. The GAPDH gene was used as a housekeeping control gene. Expression levels are expressed as mean fold change (FC) over the control, which was calculated according to the ΔΔCt method as reported in the Materials and Methods section.
Figure 3
Figure 3
Osteogenic differentiation of LMP3-expressing hMSC. Cells were transduced using either AdLMP3 or Adψ5 and osteogenic differentiation was assessed in vitro by microscopic analysis and alizarin red staining in time course. Four days after AdLMP3 transduction slight morphological changes were observed in cell culture, with the presence of a reticular web overlapping on the cell layer (a); at the same time point Adψ5-transduced cells retained the bipolar spindle-like morphology of wild-type hMSC in an homogeneous monolayer culture (b). Alizarin red staining demonstrated the progressive matrix mineralization occurring as early as 2 days after AdLMP3 transduction: 48 h (c), 72 h (d), and 4 days (e). The mineralized matrix noticeably increased at later time points: 10 (f) and 14 days (g–h). No evidence of mineralization was evidenced in Adψ5-transduced cells up to the end of the observation (i). Scale bar: 10 μm (a, b, i); 50 μm (c–e); 5 μm (f–h).
Figure 4
Figure 4
Multidimensional scaling of microarray data. Unsupervised multidimensional scaling (MDS) of the expression profiles from LMP3-transduced and control cells was performed in order to assess the segregation efficiency of samples. The high dimensionality of the gene expression data has been reduced to the three dimensions that comprise the greatest variation across the data set. All samples are represented by spheres and positioned in the three-dimensional space, so that the distance between each pair of samples very closely approximates the centered correlation distance for the corresponding sample pair. A clear separation is achieved between adenoviral-transduced and control untransduced cells along one of the three components of the plot. Triangles: AdLMP3-transduced cells; circles: cells transduced with the viral backbone Adψ5; squares: control untransduced cells.
Figure 5
Figure 5
Top biological functions. The functional analysis of the gene list allowed the identification of the biological functions that were most significant to the data set. Genes from the gene list were grouped into functional categories displayed along the x-axis; the y-axis displays the significance (−log p-value). The threshold line is set as default at p = 0.05. Distinct bar graphs are used to list the top Molecular and Cellular Functions (a) and the top Physiological System Development and Functions (b).
Figure 6
Figure 6
Schematic representation of the main modulated genes and their reciprocal interactions in the cell. Genes significantly associated to the main biological functions resulted from the functional analysis were associated in the graphical representation of their reciprocal interaction, represented as nodes, and the biological relationship between two nodes is represented as an edge (line). All edges are supported by at least 1 reference from the literature, from a textbook, or from canonical information stored in the Ingenuity Pathways Knowledge Base (www.ingenuity.com). The node color indicates the direction of gene modulations: upregulation (red) or downregulation (green). Nodes are displayed using various shapes that represent the functional class of the gene product. Separate graphs show distinct functional categories significantly associated to the gene list. (a) Cell death/cell growth and proliferation: the transcriptional modulation of the genes in this group pointed toward cell cycle arrest and the inhibition of cell proliferation, which usually precede cell differentiation. (b) Connective tissue development and function, mainly involving genes that interact reciprocally within the TGF-β1 signaling pathway. (c) Muscular and skeletal tissue development and function, which includes genes that interact either directly (such as the ACVR1 receptor on the cell membrance and the SMAD3 regulator in the nucleus) or indirectly (such as IGF2) with the TGF-β1 pathway and genes involved in extracellular matrix deposition (including PCOLCE, PCOLCE2, and the collagen isoforms COL11A1 and COL15A1), suggesting the initial osteoblastic commitment of cells (see text for additional details).
Figure 7
Figure 7
Real-time PCR validation. The expression of selected transcript from the dataset was analyzed by means of real-time PCR using sequence-specific primers and GAPDH as a housekeeping control gene. Expression levels are expressed as mean fold change over the control, which was calculated according to the ΔΔCt method as reported in the Materials and Methods section. FC1: fold change obtained by means of microarray analysis; FC2: fold change obtained in real-time PCR.

Similar articles

Cited by

References

    1. Ashburner M.; Ball C. A.; Blake J. A.; Botstein D.; Butler H.; Cherry J. M.; Davis A. P.; Dolinski K.; Dwight S. S.; Eppig J. T.; Harris M. A.; Hill D. P.; Issel-Tarver L.; Kasarskis A.; Lewis S.; Matese J. C.; Richardson J. E.; Ringwald M.; Rubin G. M.; Sherlock G. Gene ontology: Tool for the unification of biology. The Gene Ontology Consortium. Nat. Genet. 25:25–29; 2000. - PMC - PubMed
    1. Boden S. D.; Liu Y.; Hair G. A.; Helms J. A.; Hu D.; Racine M.; Nanes M. S.; Titus L. LMP-1, a LIM-domain protein, mediates BMP-6 effects on bone formation. Endocrinology 139:5125–5134; 1998. - PubMed
    1. Boden S. D.; Titus L.; Hair G.; Liu Y.; Viggeswarapu M.; Nanes M. S.; Baranowski C. Lumbar spine fusion by local gene therapy with a cDNA encoding a novel osteoinductive protein (LMP-1). Spine 23:2486–2492; 1998. - PubMed
    1. Brazma A.; Hingamp P.; Quackenbush J.; Sherlock G.; Spellman P.; Stoeckert C.; Aach J.; Ansorge W.; Ball C. A.; Causton H. C.; Gaasterland T.; Glenisson P.; Holstege F. C.; Kim I. F.; Markowitz V.; Matese J. C.; Parkinson H.; Robinson A.; Sarkans U.; Schulze-Kremer S.; Stewart J.; Taylor R.; Vilo J.; Vingron M. Minimum information about a microarray experiment (MIAME)-toward standards for microarray data. Nat. Genet. 29:365–371; 2001. - PubMed
    1. Bünger M. H.; Langdahl B. L.; Andersen T.; Husted L.; Lind M.; Eriksen E. F.; B?nger C. E. Semiquantitative mRNA measurements of osteoinductive growth factors in human iliac-crest bone: Expression of LMP splice variants in human bone. Calcif Tissue Int. 73:446–454; 2003. - PubMed

Publication types

MeSH terms

Substances

LinkOut - more resources