

Ultrasensitive and high-throughput fluorescence analysis of droplet contents with orthogonal line confocal excitation
- PMID: 21062029
- PMCID: PMC2995829
- DOI: 10.1021/ac102173m
Ultrasensitive and high-throughput fluorescence analysis of droplet contents with orthogonal line confocal excitation
Abstract
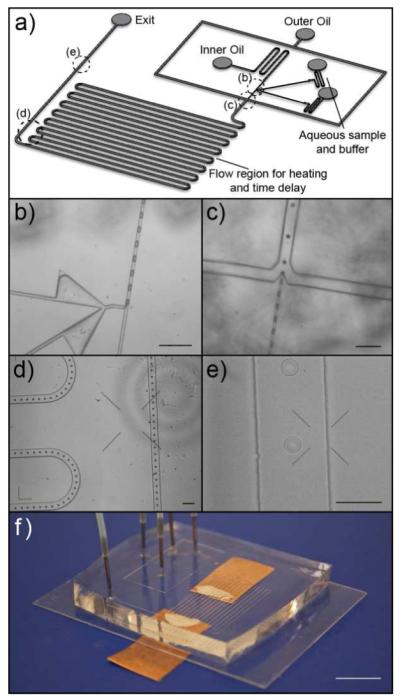
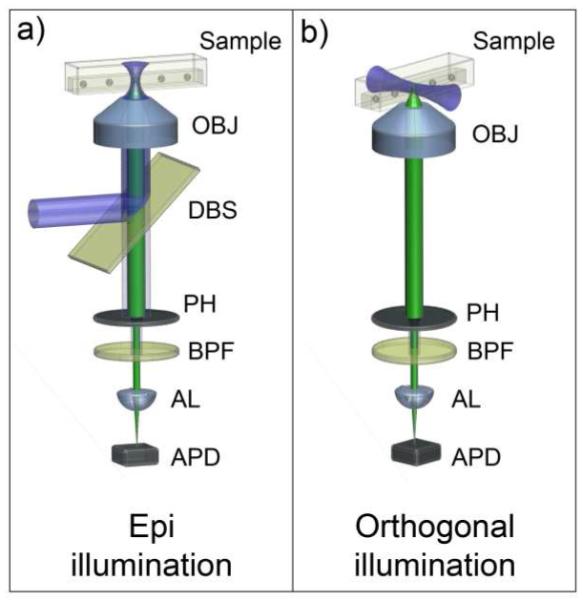
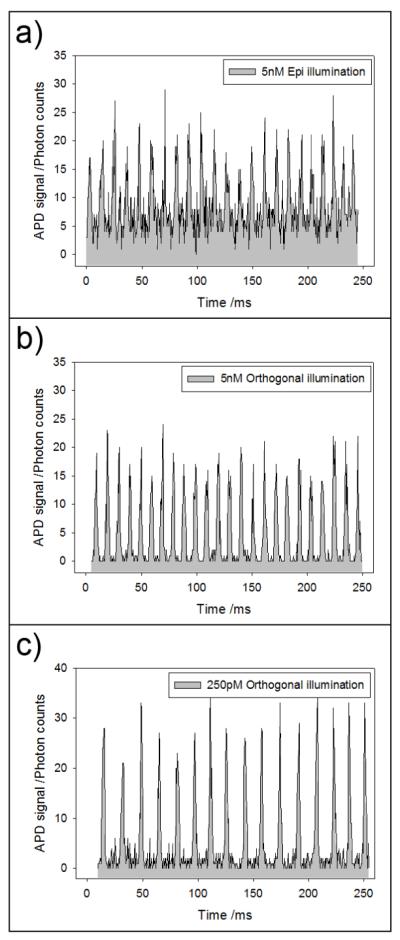
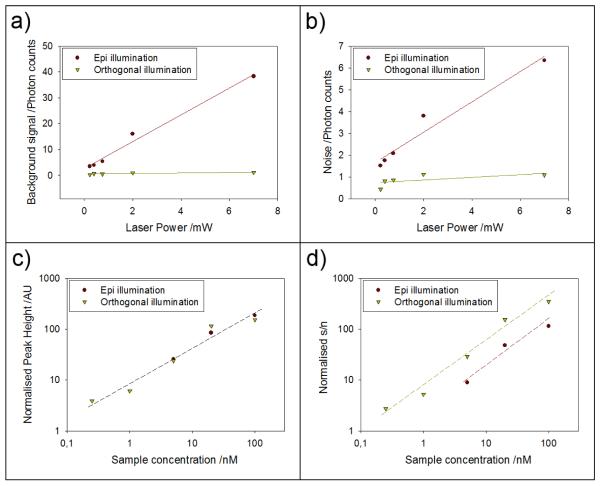
This paper describes a simple modification to traditional confocal fluorescence detection that greatly improves signal-to-noise (s/n) for the high-speed analysis of droplet streams. Rather than using the conventional epi geometry, illumination of the droplet was in the form of a line that is orthogonal to both the direction of flow and the light-collection objective. In contrast to the epi geometry where we observed high levels of scattering background from the droplets, we detected more than 10-fold less background (depending on the laser power used) when orthogonal-line-confocal illumination was used. We characterized this improvement using a standard microfluidic platform over a range of analyte concentrations and observed an improvement in limits of detection of greater than 10. Using this method, we were able to analyze picomolar concentrations of analytes contained within picoliter-volume droplets at a rate of greater than 350 droplets per second.
Figures

Similar articles
-
Automated analysis of dynamic behavior of single cells in picoliter droplets.Lab Chip. 2014 Mar 7;14(5):931-7. doi: 10.1039/c3lc51136g. Lab Chip. 2014. PMID: 24385254
-
A homogeneous assay for protein analysis in droplets by fluorescence polarization.Electrophoresis. 2012 Feb;33(3):436-9. doi: 10.1002/elps.201100350. Epub 2012 Jan 9. Electrophoresis. 2012. PMID: 22228311
-
Ultra-high throughput detection (1 million droplets per second) of fluorescent droplets using a cell phone camera and time domain encoded optofluidics.Lab Chip. 2017 Mar 14;17(6):1083-1094. doi: 10.1039/c6lc01489e. Lab Chip. 2017. PMID: 28225099
-
Analytical detection techniques for droplet microfluidics--a review.Anal Chim Acta. 2013 Jul 17;787:24-35. doi: 10.1016/j.aca.2013.04.064. Epub 2013 May 14. Anal Chim Acta. 2013. PMID: 23830418 Review.
-
Fundamentals and practice for ultrasensitive laser-induced fluorescence detection in microanalytical systems.Electrophoresis. 2004 Nov;25(21-22):3513-27. doi: 10.1002/elps.200406086. Electrophoresis. 2004. PMID: 15565706 Review.
Cited by
-
Single cell kinase signaling assay using pinched flow coupled droplet microfluidics.Biomicrofluidics. 2014 May 19;8(3):034104. doi: 10.1063/1.4878635. eCollection 2014 May. Biomicrofluidics. 2014. PMID: 24926389 Free PMC article.
-
Sensitive and high-throughput isolation of rare cells from peripheral blood with ensemble-decision aliquot ranking.Angew Chem Int Ed Engl. 2012 May 7;51(19):4618-22. doi: 10.1002/anie.201108695. Epub 2012 Feb 22. Angew Chem Int Ed Engl. 2012. PMID: 22359315 Free PMC article.
-
A droplet-based, optofluidic device for high-throughput, quantitative bioanalysis.Anal Chem. 2012 Dec 18;84(24):10745-9. doi: 10.1021/ac302623z. Epub 2012 Nov 27. Anal Chem. 2012. PMID: 23140515 Free PMC article.
-
The potential impact of droplet microfluidics in biology.Anal Chem. 2013 Apr 2;85(7):3476-82. doi: 10.1021/ac400257c. Epub 2013 Mar 15. Anal Chem. 2013. PMID: 23495853 Free PMC article.
-
Total internal reflection fluorescence microscopy imaging-guided confocal single-molecule fluorescence spectroscopy.Rev Sci Instrum. 2012 Jan;83(1):013110. doi: 10.1063/1.3677334. Rev Sci Instrum. 2012. PMID: 22299932 Free PMC article.
References
-
- Srinivasan V, Pamula VK, Fair RB. An integrated digital microfluidic lab-on-a-chip for clinical diagnostics on human physiological fluids. Lab on a Chip. 2004;4(4):310–315. - PubMed
-
- Hong JW, Quake SR. Integrated nanoliter systems. Nat Biotech. 2003;21(10):1179–1183. - PubMed
-
- Barbulovic-Nad I, Yang H, Park PS, Wheeler AR. Digital microfluidics for cell-based assays. Lab on a Chip. 2008;8(4):519–526. - PubMed
-
- Sinclair J, Pihl J, Olofsson J, Karlsson M, Jardemark K, Chiu DT, Orwar O. A cell-based bar code reader for high-throughput screening of ion channel-ligand interactions. Analytical Chemistry. 2002;74(24):6133–6138. - PubMed
Publication types
MeSH terms
Substances
Grants and funding
LinkOut - more resources
Full Text Sources
Other Literature Sources
