Frequency and location of head impact exposures in individual collegiate football players
- PMID: 21062178
- PMCID: PMC2978006
- DOI: 10.4085/1062-6050-45.6.549
Frequency and location of head impact exposures in individual collegiate football players
Abstract
Context: Measuring head impact exposure is a critical step toward understanding the mechanism and prevention of sport-related mild traumatic brain (concussion) injury, as well as the possible effects of repeated subconcussive impacts.
Objective: To quantify the frequency and location of head impacts that individual players received in 1 season among 3 collegiate teams, between practice and game sessions, and among player positions.
Design: Cohort study.
Setting: Collegiate football field.
Patients or other participants: One hundred eighty-eight players from 3 National Collegiate Athletic Association football teams.
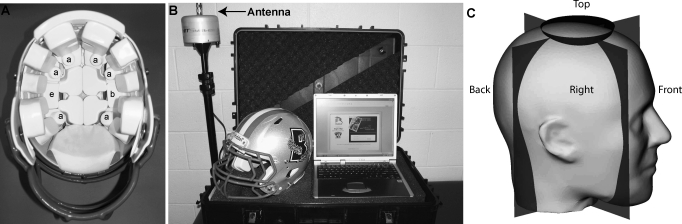
Intervention(s): Participants wore football helmets instrumented with an accelerometer-based system during the 2007 fall season.
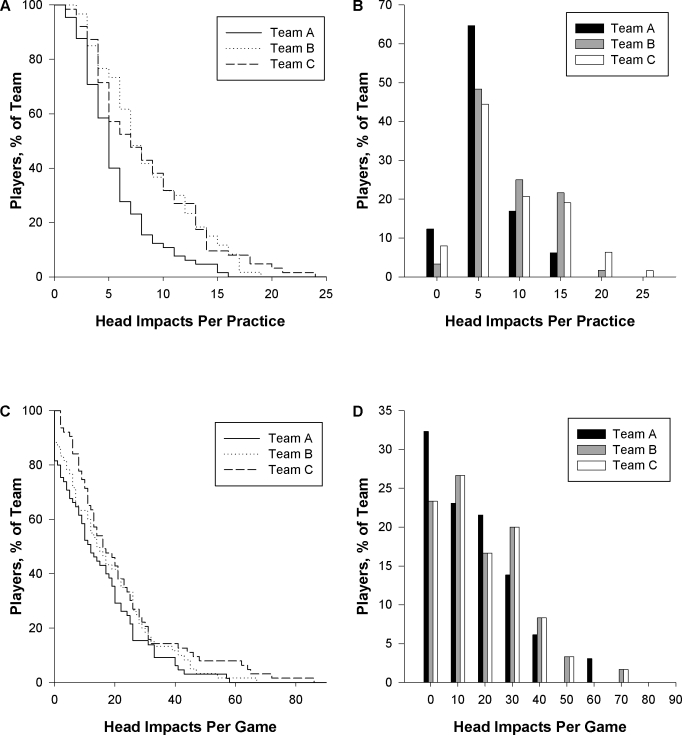
Main outcome measure(s): The number of head impacts greater than 10 g and location of the impacts on the player's helmet were recorded and analyzed for trends and interactions among teams (A, B, or C), session types, and player positions using Kaplan-Meier survival curves.
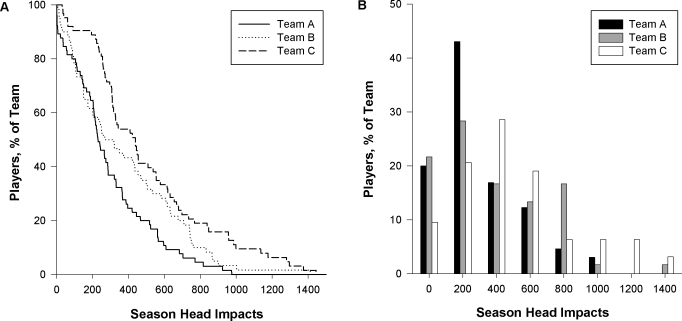
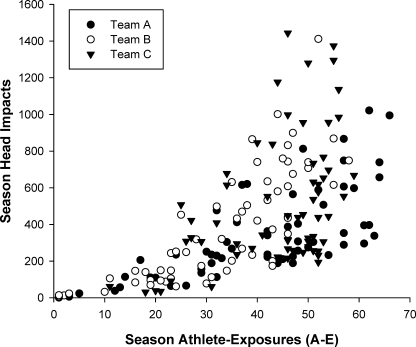
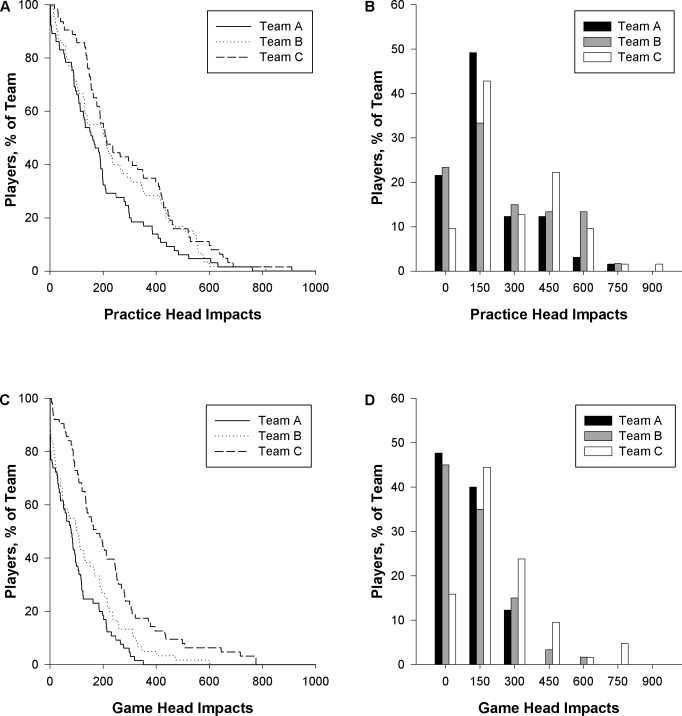
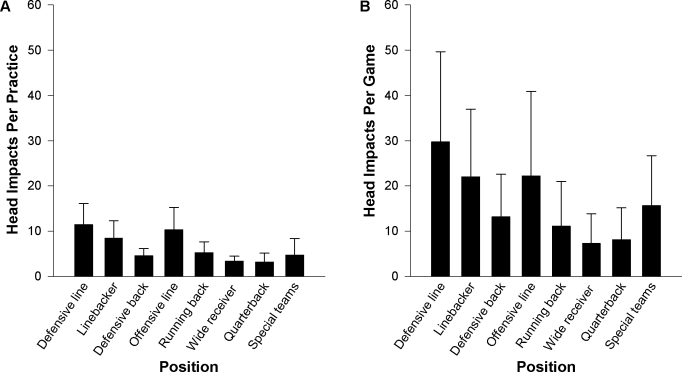
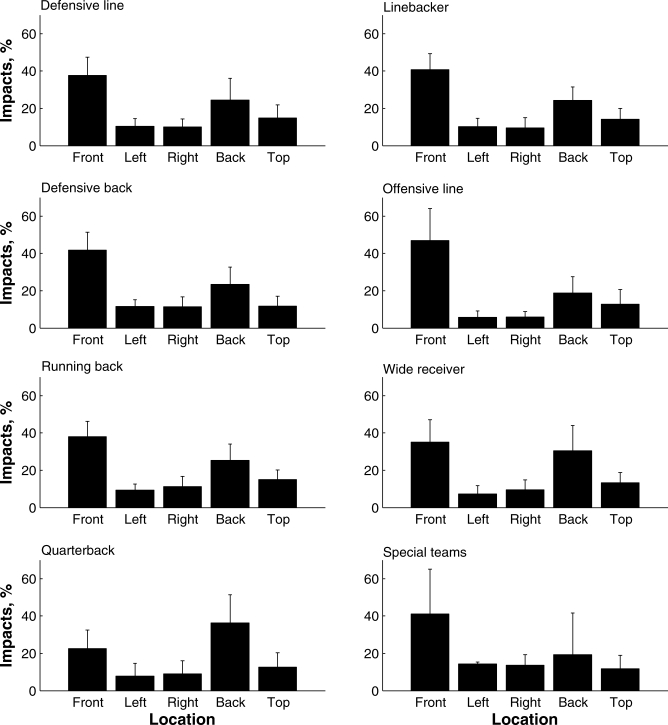
Results: The total number of impacts players received was nonnormally distributed and varied by team, session type, and player position. The maximum number of head impacts for a single player on each team was 1022 (team A), 1412 (team B), and 1444 (team C). The median number of head impacts on each team was 4.8 (team A), 7.5 (team B), and 6.6 (team C) impacts per practice and 12.1 (team A), 14.6 (team B), and 16.3 (team C) impacts per game. Linemen and linebackers had the largest number of impacts per practice and per game. Offensive linemen had a higher percentage of impacts to the front than to the back of the helmet, whereas quarterbacks had a higher percentage to the back than to the front of the helmet.
Conclusions: The frequency of head impacts and the location on the helmet where the impacts occur are functions of player position and session type. These data provide a basis for quantifying specific head impact exposure for studies related to understanding the biomechanics and clinical aspects of concussion injury, as well as the possible effects of repeated subconcussive impacts in football.
Figures
References
-
- Gerberding J. L. Report to Congress on Mild Traumatic Brain Injury in the United States: Steps to Preventing a Serious Public Health Problem. Atlanta, GA: Centers for Disease Control and Prevention; 2003.
-
- Thurman D. J., Branche C. M., Sniezek J. E. The epidemiology of sports-related traumatic brain injuries in the United States: recent developments. J Head Trauma Rehabil. 1998;13(2):1–8. - PubMed
-
- Powell J. W., Barber-Foss K. D. Traumatic brain injury in high school athletes. JAMA. 1999;282(10):958–963. - PubMed
-
- Collins M. W., Lovell M. R., McKeag D. B. Current issues in managing sports-related concussion. JAMA. 1999;282(24):2283–2285. - PubMed
Publication types
MeSH terms
Grants and funding
LinkOut - more resources
Full Text Sources
Other Literature Sources
Medical