. 2011 Apr;218(4):363-74.
doi: 10.1111/j.1469-7580.2010.01310.x. Epub 2010 Nov 10.

Functional anatomy of the cheetah (Acinonyx jubatus) hindlimb

Affiliations

Functional anatomy of the cheetah (Acinonyx jubatus) hindlimb

Penny E Hudson et al. J Anat. 2011 Apr.

Abstract

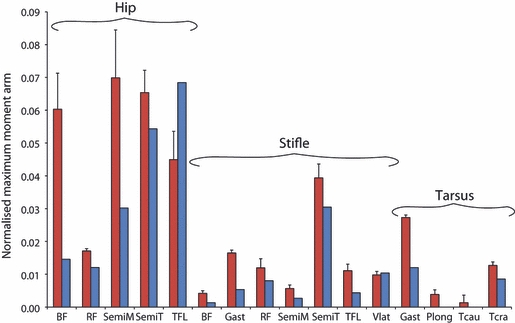
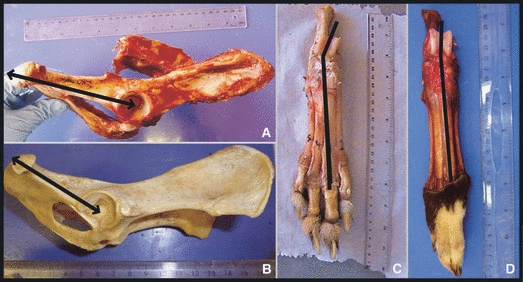
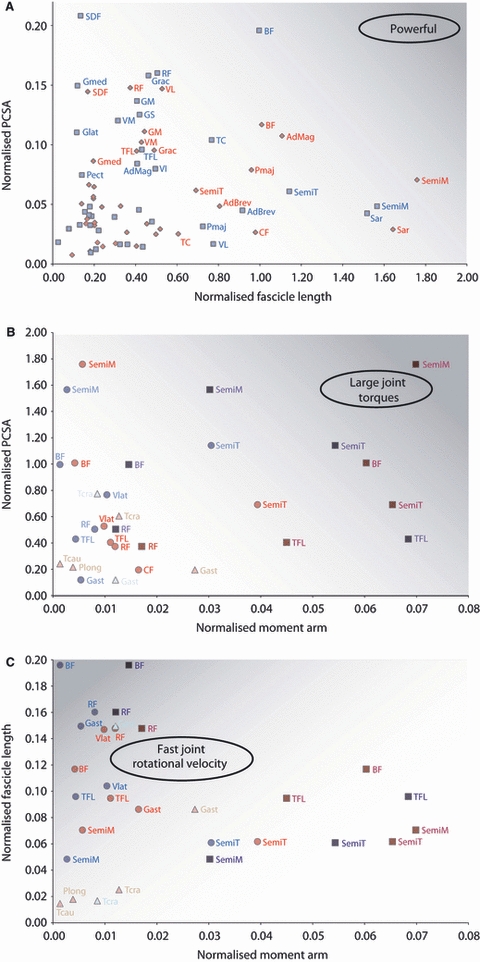
The cheetah is capable of a top speed of 29 ms(-1) compared to the maximum speed of 17 ms(-1) achieved by the racing greyhound. In this study of the hindlimb and in the accompanying paper on the forelimb we have quantified the musculoskeletal anatomy of the cheetah and greyhound and compared them to identify any differences that may account for this variation in their locomotor abilities. Specifically, bone length, mass and mid-shaft diameter were measured, along with muscle mass, fascicle lengths, pennation angles and moment arms to enable estimates of maximal isometric force, joint torques and joint rotational velocities to be calculated. Surprisingly the cheetahs had a smaller volume of hip extensor musculature than the greyhounds, and we therefore propose that the cheetah powers acceleration using its extensive back musculature. The cheetahs also had an extremely powerful psoas muscle which could help to resist the pitching moments around the hip associated with fast accelerations. The hindlimb bones were proportionally longer and heavier, enabling the cheetah to take longer strides and potentially resist higher peak limb forces. The cheetah therefore possesses several unique adaptations for high-speed locomotion and fast accelerations, when compared to the racing greyhound.


Figures

Fig. 1
Fig. 1
Experimental set-up used for collecting moment arms. Two markers were used on each segment to determine the joint angle, two at a 4 cm distance for calibration and two to measure tendon travel.
Fig. 2
Fig. 2
Schematic illustration of muscle origins and insertions in the cheetah. Origins are in red and insertions in blue. Muscle name abbreviations are given in Table 3.
Fig. 3
Fig. 3
Proximal to distal distribution of muscle mass. Bars are representative of means + SE. Species comparison made by performing a Mann–Whitney U test (*P < 0.05; **P < 0.01). Cheetah values are in red and greyhound values in blue. Muscle name abbreviations are given in Table 3.
Fig. 4
Fig. 4
Functional distribution of muscle mass. Bars are means + SEs. Species comparison made by performing a Mann–Whitney U test (*P < 0.05; **P < 0.01). Cheetah values are in red and greyhound values in blue.
Fig. 5
Fig. 5
Maximum moment arms of muscles functioning at the hip, stifle and tarsus in the cheetah (red) and greyhound (blue) (Williams et al. 2008a,;). Bars represent means + SEs. Only means were available for the greyhound.
Fig. 6
Fig. 6
Skeletal morphology. (A) Cheetah and (B) greyhound: the lateral aspect of the pelvis, with the black arrows illustrating the elongated ishium in the cheetah. (C) Cheetah and (D) greyhound: the dorsal aspect of the hindfeet with the black line illustrating the increased angle of divergence of the talar ridges (which articulate with the tibia) in the cheetah.
Fig. 7
Fig. 7
(A) Physiological cross-sectional area (PCSA) against fascicle length to illustrate the balance between force, range of motion/velocity and power output for different muscles. All architectural data was normalised geometrically to total limb muscle mass. (B) Moment arm against PCSA to illustrate the muscle's ability to produce large joint moments. (C) Moment arm against fascicle length to illustrate the muscle's ability to rotate the joint rapidly. All moment arm data were normalised to bone lengths. Darker shaded areas of the graphs represent increased power output (A), large joint torques (B) and faster joint rotational velocity (C). Cheetah values are represented in red and greyhound values in blue. In (B) and (C), muscles acting at the hip are represented by squares, those acting at the stifle by circles, and those acting at the tarsus by triangles. Muscle name abbreviations are given in Table 3.

References

    1. Alexander RM. Why Mammals Gallop 1. Integr Comp Biol. 1988;28:237–245.
    1. Alexander RM. Optimization of structure and movement of the legs of animals. J Biomech. 1993;26(Suppl. 1):1–6. - PubMed
    1. Alexander RM. Principles of Animal Locomotion. Princeton: Princeton University Press; 2003.
    1. Alexander RMN, Jayes AS. Vertical movements in walking and running. J Zool Lond. 1978;185:27–40.
    1. Alexander RM, Dimery NJ, Ker RF. Elastic structures in the back and their role in galloping in some mammals. J Zool. 1985;207:467–482.

Publication types

LinkOut - more resources