Comparative Study
. 2010 Nov 9;12(1):63.
doi: 10.1186/1532-429X-12-63.

Automated left ventricular diastolic function evaluation from phase-contrast cardiovascular magnetic resonance and comparison with Doppler echocardiography

Affiliations
Comparative Study

Automated left ventricular diastolic function evaluation from phase-contrast cardiovascular magnetic resonance and comparison with Doppler echocardiography

Emilie Bollache et al. J Cardiovasc Magn Reson. .

Abstract

Background: Early detection of diastolic dysfunction is crucial for patients with incipient heart failure. Although this evaluation could be performed from phase-contrast (PC) cardiovascular magnetic resonance (CMR) data, its usefulness in clinical routine is not yet established, mainly because the interpretation of such data remains mostly based on manual post-processing. Accordingly, our goal was to develop a robust process to automatically estimate velocity and flow rate-related diastolic parameters from PC-CMR data and to test the consistency of these parameters against echocardiography as well as their ability to characterize left ventricular (LV) diastolic dysfunction.

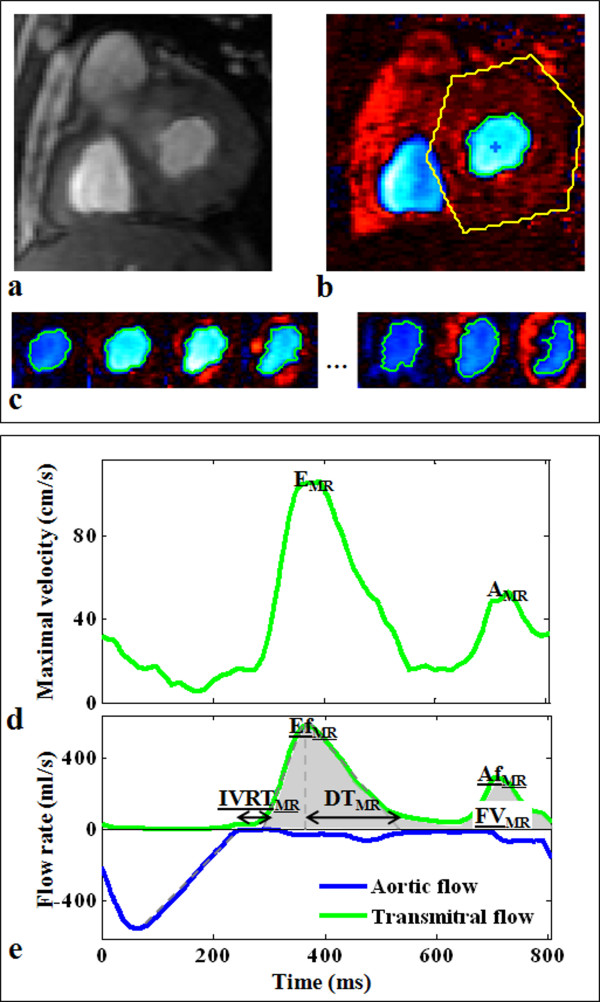
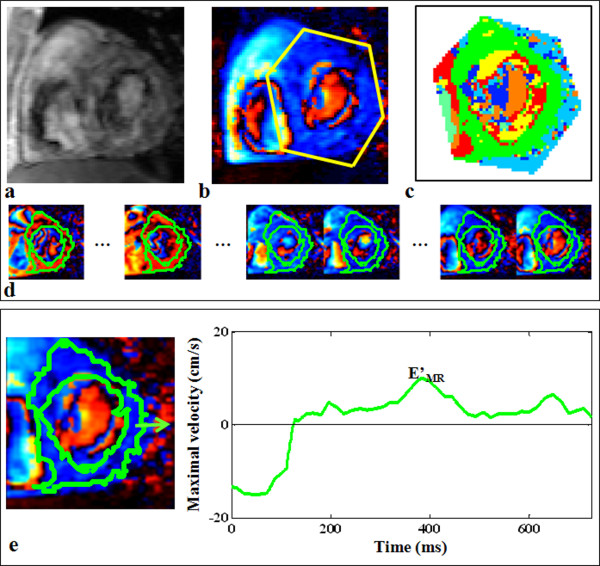
Results: We studied 35 controls and 18 patients with severe aortic valve stenosis and preserved LV ejection fraction who had PC-CMR and Doppler echocardiography exams on the same day. PC-CMR mitral flow and myocardial velocity data were analyzed using custom software for semi-automated extraction of diastolic parameters. Inter-operator reproducibility of flow pattern segmentation and functional parameters was assessed on a sub-group of 30 subjects. The mean percentage of overlap between the transmitral flow segmentations performed by two independent operators was 99.7 ± 1.6%, resulting in a small variability (<1.96 ± 2.95%) in functional parameter measurement. For maximal myocardial longitudinal velocities, the inter-operator variability was 4.25 ± 5.89%. The MR diastolic parameters varied significantly in patients as opposed to controls (p < 0.0002). Both velocity and flow rate diastolic parameters were consistent with echocardiographic values (r > 0.71) and receiver operating characteristic (ROC) analysis revealed their ability to separate patients from controls, with sensitivity > 0.80, specificity > 0.80 and accuracy > 0.85. Slight superiority in terms of correlation with echocardiography (r = 0.81) and accuracy to detect LV abnormalities (sensitivity > 0.83, specificity > 0.91 and accuracy > 0.89) was found for the PC-CMR flow-rate related parameters.

Conclusions: A fast and reproducible technique for flow and myocardial PC-CMR data analysis was successfully used on controls and patients to extract consistent velocity-related diastolic parameters, as well as flow rate-related parameters. This technique provides a valuable addition to established CMR tools in the evaluation and the management of patients with diastolic dysfunction.


Figures

Figure 1
Figure 1
Colour-coded display of the blood flow and myocardial longitudinal velocity-encoded PC images. Panel a: blood flow velocity images, selected during a systolic phase (left), in which we can visualize the aortic ejection flow, and a diastolic phase (right), in which we can visualize the transmitral filling flow. Panel b: myocardial longitudinal velocity images, selected at the beginning of the systolic phase (left) and at the beginning of the diastolic phase (right). Negative velocity values were colour-coded in hot tones while positive velocity values were colour-coded in cold tones, to distinguish between through plane velocities in both directions.
Figure 2
Figure 2
Example of segmentation and diastolic parameters extraction from a transmitral flow PC dataset. Top: description of the segmentation process performed semi-automatically on a velocity-encoded image after manual drawing of a rough region of interest around the transmitral flow (b). This segmentation resulted in a robust delineation of the transmitral flow pattern on each cardiac phase, as shown on the few selected phases (c) (see additional file 1: flowVideo, video file corresponding to the whole cardiac cycle). Of note, the modulus image corresponding to the phase image (b) was shown (a) to highlight the difficulty of segmenting such images. Bottom: the parameters automated extraction from the transmitral flow maximal velocity curve (d), and the transmitral (green) as well as the aortic (blue) flow rate curves (e), using the above segmentation. The estimated diastolic parameters (EMR, AMR, DTMR, IVRTMR, EfMR, AfMR, FVMR) are indicated on velocity (d) and flow rate (e) curves.
Figure 3
Figure 3
Example of longitudinal tissue velocity evaluation from a myocardial PC dataset. Top: detection of the myocardial cluster on a velocity-encoded image (b) using the k-means map (c), after manual drawing of a rough region of interest around the myocardium. The contours corresponding to the calculated myocardial cluster were superimposed on each cardiac phase, and shown on few selected phases (d) (see additional file 2: myocardiumVideo, video file corresponding to the whole cardiac cycle). Of note, the modulus image corresponding to the phase image (b) was shown (a) to highlight the difficulty of segmenting such images. Bottom: extraction of early peak diastolic longitudinal velocity (E'MR).
Figure 4
Figure 4
Comparison between echocardiographic and CMR early to late peak ratios and mitral annulus peak longitudinal velocities. Panel a: comparison of the CMR velocity (EMR/AMR) and flow rate (EfMR/AfMR) ratios against the echocardiographic velocity ratio (EUS/AUS). Panel b: comparison between the mitral annulus peak longitudinal velocities estimated from echocardiographic data (E'US) and CMR data (E'MR).
Figure 5
Figure 5
Comparison of the echocardiographic and the CMR deceleration times against the echocardiographic mitral annulus peak longitudinal velocity. Panel a: comparison between the echocardiographic mitral annulus peak longitudinal velocity (E'US) and the CMR deceleration time (DTMR). Panel b: comparison between the echocardiographic mitral annulus peak longitudinal velocity (E'US) and the echocardiographic deceleration time (DTUS).

References

    1. Zile MR, Baicu CF, Gaasch WH. Diastolic heart failure--abnormalities in active relaxation and passive stiffness of the left ventricle. N Engl J Med. 2004;350:1953–1959. doi: 10.1056/NEJMoa032566. - DOI - PubMed
    1. Achong N, Wahi S, Marwick TH. Evolution and outcome of diastolic dysfunction. Heart. 2009;95:813–818. doi: 10.1136/hrt.2008.159020. - DOI - PubMed
    1. Persson H, Lonn E, Edner M, Baruch L, Lang CC, Morton JJ, Ostergren J, McKelvie RS. Diastolic dysfunction in heart failure with preserved systolic function: need for objective evidence:results from the CHARM Echocardiographic Substudy-CHARMES. J Am Coll Cardiol. 2007;49:687–694. doi: 10.1016/j.jacc.2006.08.062. - DOI - PubMed
    1. Nagueh SF, Appleton CP, Gillebert TC, Marino PN, Oh JK, Smiseth OA, Waggoner AD, Flachskampf FA, Pellikka PA, Evangelista A. Recommendations for the evaluation of left ventricular diastolic function by echocardiography. J Am Soc Echocardiogr. 2009;22:107–133. doi: 10.1016/j.echo.2008.11.023. - DOI - PubMed
    1. Bess RL, Khan S, Rosman HS, Cohen GI, Allebban Z, Gardin JM. Technical aspects of diastology: why mitral inflow and tissue Doppler imaging are the preferred parameters? Echocardiography. 2006;23:332–339. doi: 10.1111/j.1540-8175.2006.00215.x. - DOI - PubMed

Publication types

MeSH terms