. 2011 Jan 14;286(2):1436-44.
doi: 10.1074/jbc.M110.145870. Epub 2010 Nov 9.

Up-regulation of microRNA-155 in macrophages contributes to increased tumor necrosis factor {alpha} (TNF{alpha}) production via increased mRNA half-life in alcoholic liver disease

Affiliations

Up-regulation of microRNA-155 in macrophages contributes to increased tumor necrosis factor {alpha} (TNF{alpha}) production via increased mRNA half-life in alcoholic liver disease

Shashi Bala et al. J Biol Chem. .

Abstract

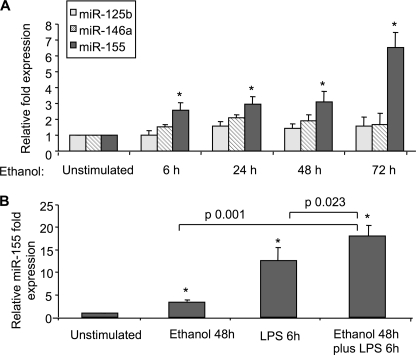
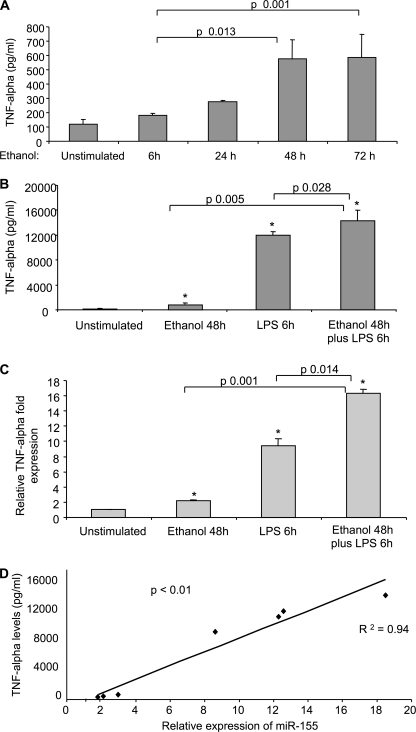
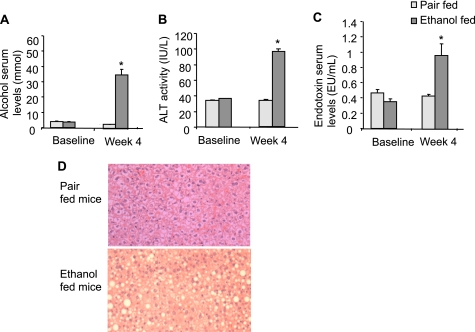
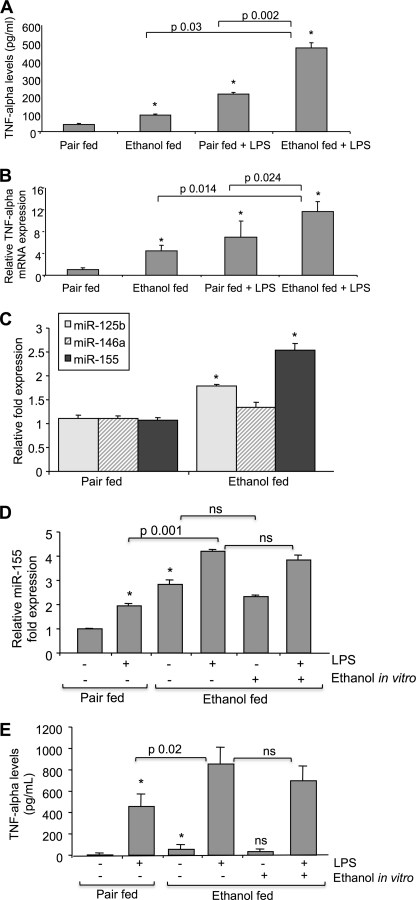
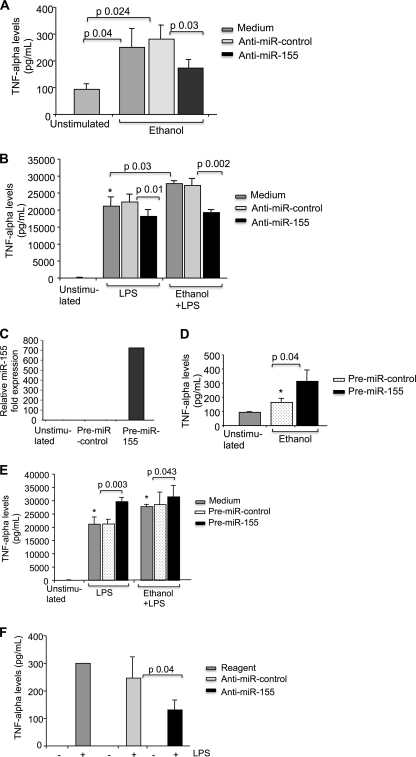
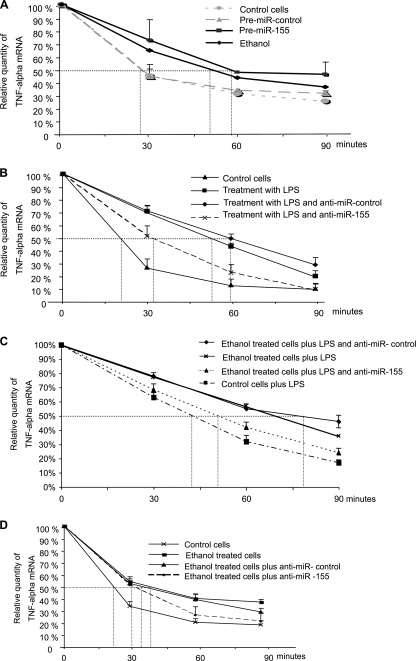
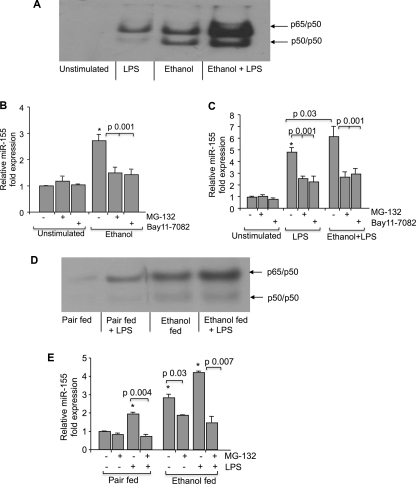
Activation of Kupffer cells (KCs) by gut-derived lipopolysaccharide (LPS) and Toll-Like Receptors 4 (TLR4)-LPS-mediated increase in TNFα production has a central role in the pathogenesis of alcoholic liver disease. Micro-RNA (miR)-125b, miR-146a, and miR-155 can regulate inflammatory responses to LPS. Here we evaluated the involvement of miRs in alcohol-induced macrophage activation. Chronic alcohol treatment in vitro resulted in a time-dependent increase in miR-155 but not miR-125b or miR-146a levels in RAW 264.7 macrophages. Furthermore, alcohol pretreatment augmented LPS-induced miR-155 expression in macrophages. We found a linear correlation between alcohol-induced increase in miR-155 and TNFα induction. In a mouse model of alcoholic liver disease, we found a significant increase in both miR-155 levels and TNFα production in isolated KCs when compared with pair-fed controls. The mechanistic role of miR-155 in TNFα regulation was indicated by decreased TNFα levels in alcohol-treated macrophages after inhibition of miR-155 and by increased TNFα production after miR-155 overexpression, respectively. We found that miR-155 affected TNFα mRNA stability because miR-155 inhibition decreased whereas miR-155 overexpression increased TNFα mRNA half-life. Using the NF-κB inhibitors, MG-132 or Bay11-7082, we demonstrated that NF-κB activation mediated the up-regulation of miR-155 by alcohol in KCs. In conclusion, our novel data demonstrate that chronic alcohol consumption increases miR-155 in macrophages via NF-κB and the increased miR-155 contributes to alcohol-induced elevation in TNFα production via increased mRNA stability.


Figures

FIGURE 1.
FIGURE 1.
Enhanced miR-155 expression in RAW 264.7 macrophages after LPS and/or alcohol treatment. A, RAW 264.7 macrophages were stimulated with 50 mm alcohol for the indicated time points. B, RAW 264.7 macrophages were stimulated with 50 mm alcohol for 48 h, with LPS for 6 h, or with LPS for 6 h after 48 h of alcohol pretreatment. Expression of miR-125b, miR-146a, and miR-155 was assayed by qPCR, and data were normalized to sno202 control. The -fold increase in the expression of these miRNAs versus non-stimulated cells is shown. Data represent the mean value (S.E. indicated by error bars) of at least three independent experiments. Statistically significant differences are shown (* indicates p ≤ 0.05 versus unstimulated cells).
FIGURE 2.
FIGURE 2.
TNFα production is increased in RAW 264.7 macrophages after LPS and/or alcohol treatment and correlates with miR-155 expression. A, RAW 264.7 macrophages were stimulated with 50 mm alcohol for the indicated time points, and TNFα levels were measured in supernatants by ELISA. B and C, RAW 264.7 macrophages were stimulated with 50 mm alcohol for 48 h or LPS for 6 h or with LPS for 6 h after 48 h of alcohol pretreatment. TNFα levels were measured in supernatants by ELISA, and TNFα mRNA was quantified using specific primers in real-time PCR. Data represent the mean value (S.E. indicated by error bars) of at least three independent experiments. (* indicates p ≤ 0.05 versus unstimulated cells). Statistically significant differences are shown. D, the correlation between miR-155 expression and TNFα production in RAW 264.7 macrophages under different conditions (50 mm alcohol for 6, 24, and 48 h and 100 ng/ml LPS for 6 h with or without alcohol pretreatment) is shown (R2 = 0.94, p < 0.01). Expression of miR-155 was assayed by qPCR, and data were normalized to sno202 control. TNFα levels were measured in supernatants by ELISA after collection of the medium in the same samples. Each dot represents the average of at least three independent experiments.
FIGURE 3.
FIGURE 3.
Chronic alcohol feeding induced liver steatohepatitis in mice as well as increased alcohol, alanine aminotransferase, and endotoxin serum levels. A–C, mice (15/group) received the Lieber-DeCarli diet for 4 weeks as described under “Experimental Procedures.” Blood was collected after 4 weeks of feeding, and serum was separated and analyzed for alcohol (A), alanine aminotransferase (ALT) (B), and endotoxin levels (C). Mean values with S.E. (error bars) are shown (n = 10). (* indicates p < 0.05 when compared with pair-fed mice.) EU, endotoxin units. D, representative sections of formalin-fixed, paraffin-embedded livers stained with hematoxylin and eosin of each group are shown.
FIGURE 4.
FIGURE 4.
Enhanced miR-155 expression and TNFα in Kupffer cells of chronic alcohol-fed mice. A and B, Kupffer cells isolated from pair-fed or alcohol-fed mice were pooled (n = 5/group) and cultured for 10–12 h followed by stimulation with 0 or 100 ng/ml LPS for 6 h. A, TNFα levels were measured in supernatants by ELISA. Data represent the mean value (S.E. indicated by error bars). B, total RNA was isolated and analyzed for mRNA levels of TNFα using specific primers in real-time PCR. Values of relative TNFα mRNA expression normalized for housekeeping gene 18 S are shown as mean (S.E. indicated by error bars). Statistically significant differences are shown (*, p ≤ 0.05 versus pair-fed control cells). C, Kupffer cells isolated from pair-fed or alcohol-fed mice were pooled (n = 5/group), cultured for 14 h, and harvested. Total RNA was extracted, and expression of miR-125b, miR-146a, and miR-155 was assayed by qPCR. Kupffer cells isolated from pair-fed and alcohol-fed mice were treated or not in vitro with 100 ng/ml LPS, and Kupffer cells isolated from alcohol-fed mice were further stimulated in vitro with 25 mm alcohol or alcohol plus LPS for 6 h. D, total RNA was isolated and analyzed for miR-155 expression. E, supernatants were analyzed for TNFα levels by ELISA. Data were normalized to sno202 control, and the -fold increase in the expression of these miRs in Kupffer cells from alcohol-fed mice versus Kupffer cells from pair-fed mice is shown. Data represent the mean value (S.E. indicated by error bars). Statistically significant differences are shown (*, p ≤ 0.05 versus Kupffer cells from pair-fed mice). ns, non-statistically significant.
FIGURE 5.
FIGURE 5.
miR-155 regulates TNFα production. A–E, RAW 264.7 macrophages were transfected with anti-miR-control or anti-miR-155 (A and B) with pre-miR-control or pre-miR-155 (C–E), exposed to 50 mm alcohol for 48 h (A, B, D, and E), and further stimulated or not with 100 ng/ml LPS for 6 h as indicated. Culture medium was collected, and supernatants were analyzed for TNFα production by ELISA. Mean values of TNFα (S.E. indicated by error bars) from three independent experiments are shown. C, mature miR-155 expression was assayed by qPCR and normalized to sno202 control after transfection with pre-miR-control or pre-miR-155. Data from two experiments (mean ± S.E.) are shown. F, Kupffer cells from alcohol-fed mice were transfected with anti-miR-control or anti-miR-155 using an Amaxa transfection kit, medium was changed after 4–6 h of transfection and stimulated on the next day or not with 100 ng/ml LPS for 6 h, and culture supernatant was collected and analyzed for TNFα production by ELISA. Mean values of TNFα from three independent experiments are shown. Statistically significant differences are shown (*, p < 0.05).
FIGURE 6.
FIGURE 6.
miR-155 increases TNFα secretion by means of affecting TNFα mRNA stability. A–D, RAW 264.7 macrophages were transfected with pre-miR-control or pre-miR-155 and treated or not with alcohol for 48 h (A) or transfected with anti-miR-control or anti-miR-155, treated with LPS or alcohol plus LPS or alcohol alone as indicated (B–D), and further cultured in the presence of 5 μg/ml actinomycin D (A–D). Total RNA was isolated at the times shown, and TNFα mRNA was quantified using specific primers in real-time PCR. Data were normalized with the housekeeping gene 18 S, and half-life is indicated as the percentage of remaining TNFα at different time points showing one experiment out of three with similar results or as absolute numbers (mean ± S.E. (error bars)) from three experiments.
FIGURE 7.
FIGURE 7.
Treatment with NF-κB inhibitors Bay 11-7082 or MG-132 prevented miR-155 increase in response to alcohol. A, RAW 264.7 macrophages were treated with alcohol for 48 h and treated or not with LPS for 30 min, and nuclear proteins were subjected to EMSA. B and C, for NF-κB inhibition, RAW 264.7 macrophages were pretreated with Bay11-7082 (0.1 μm) or MG-132 (0.25 μm) or DMSO as a negative control for 30 min and then exposed or not to alcohol (50 mm) for 48 h and further treated or not with LPS for 6 h. Expression of miR-155 was assayed by qPCR, and data were normalized to sno202 control. The -fold increase in the expression of miR-155 versus non-stimulated cells is shown. Data represent the mean value (S.E. indicated by error bars) of at least three independent experiments. D, Kupffer cells isolated from pair-fed or alcohol-fed animals (n = 8) were pooled and treated or not with 100 ng/ml LPS for 30 min, and 10 μg of whole cell lysate were subjected to EMSA to evaluate NF-κB activation. E, for NF-κB inhibition, Kupffer cells from pair-fed or alcohol-fed animals (n = 10) were pretreated with MG-132 (2.5 μm) or DMSO for 30 min and further stimulated or not with 100 ng/ml LPS for 6 h. Expression of miR-155 was assayed by qPCR, data were normalized to sno202 control, and the -fold increase in the expression of miR-155 in Kupffer cells from alcohol-fed mice versus Kupffer cells from pair-fed mice is shown. Data represent the mean value (S.E. indicated by error bars). Statistically significant differences are shown (*, p < 0.05).

References

    1. Baltimore D., Boldin M. P., O'Connell R. M., Rao D. S., Taganov K. D. (2008) Nat. Immunol. 9, 839–845 - PubMed
    1. Bi Y., Liu G., Yang R. (2009) J. Cell. Physiol. 218, 467–472 - PubMed
    1. O'Connell R. M., Taganov K. D., Boldin M. P., Cheng G., Baltimore D. (2007) Proc Natl. Acad. Sci. 104, 1604–1609 - PMC - PubMed
    1. Perry M. M., Moschos S. A., Williams A. E., Shepherd N. J., Larner-Svensson H. M., Lindsay M. A. (2008) J. Immunol. 180, 5689–5698 - PMC - PubMed
    1. Tili E., Michaille J. J., Cimino A., Costinean S., Dumitru C. D., Adair B., Fabbri M., Alder H., Liu C. G., Calin G. A., Croce C. M. (2007) J. Immunol. 179, 5082–5089 - PubMed

Publication types

MeSH terms

LinkOut - more resources