. 2010 Dec;137(23):4061-72.
doi: 10.1242/dev.052118.

Jagged1 in the portal vein mesenchyme regulates intrahepatic bile duct development: insights into Alagille syndrome

Affiliations

Jagged1 in the portal vein mesenchyme regulates intrahepatic bile duct development: insights into Alagille syndrome

Jennifer J Hofmann et al. Development. 2010 Dec.

Abstract

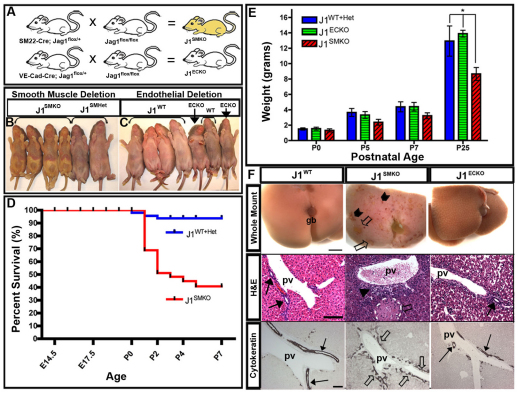
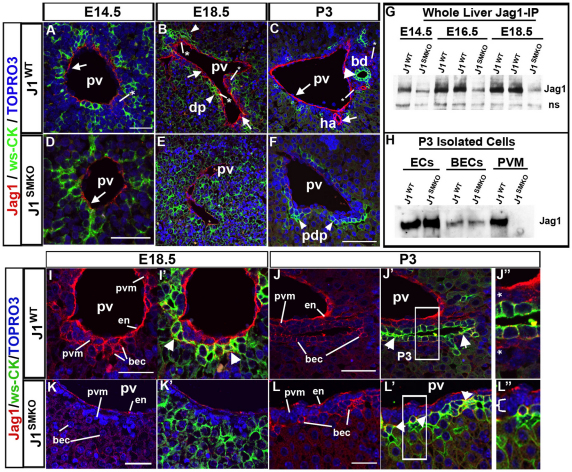
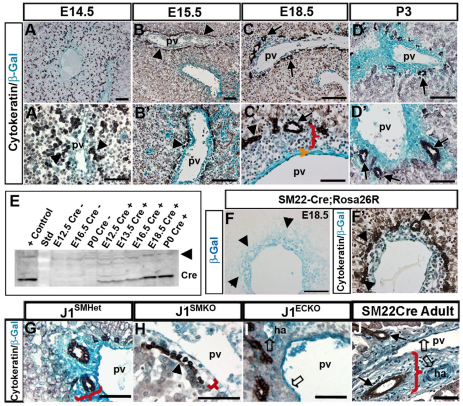
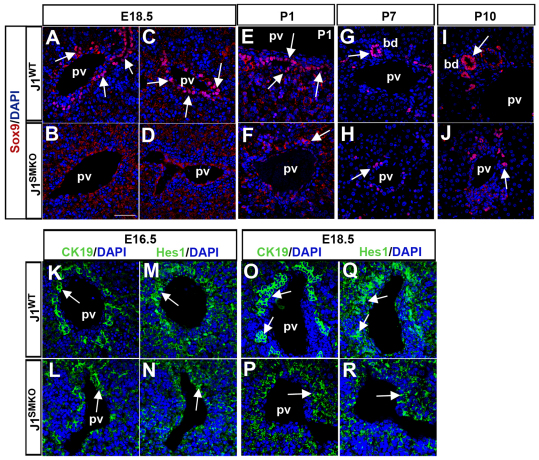
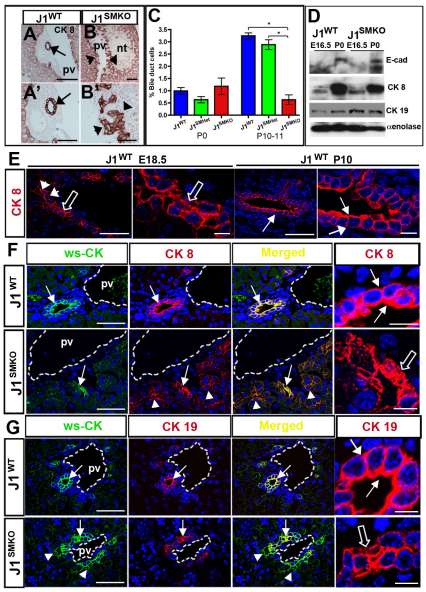
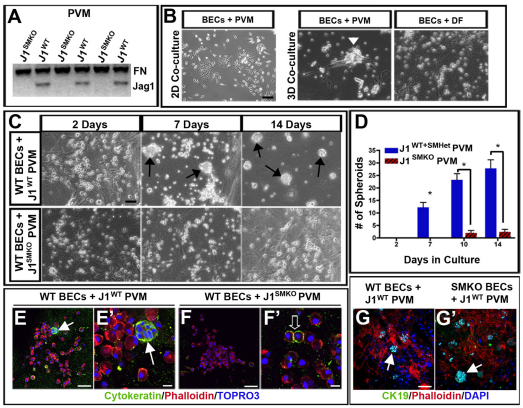
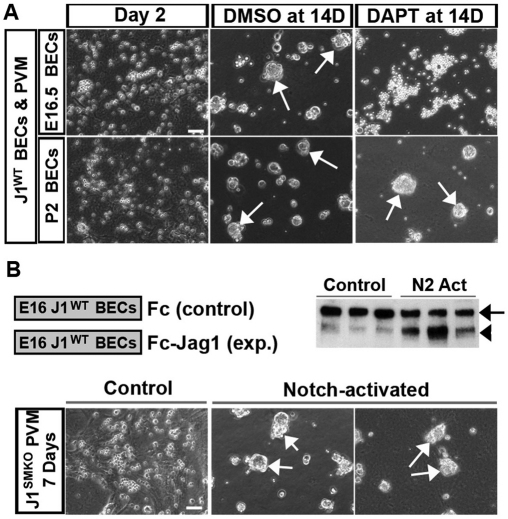
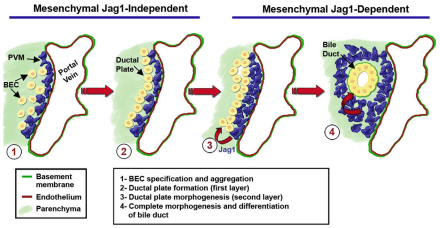
Mutations in the human Notch ligand jagged 1 (JAG1) result in a multi-system disorder called Alagille syndrome (AGS). AGS is chiefly characterized by a paucity of intrahepatic bile ducts (IHBD), but also includes cardiac, ocular, skeletal, craniofacial and renal defects. The disease penetration and severity of the affected organs can vary significantly and the molecular basis for this broad spectrum of pathology is unclear. Here, we report that Jag1 inactivation in the portal vein mesenchyme (PVM), but not in the endothelium of mice, leads to the hepatic defects associated with AGS. Loss of Jag1 expression in SM22α-positive cells of the PVM leads to defective bile duct development beyond the initial formation of the ductal plate. Cytokeratin 19-positive cells are detected surrounding the portal vein, yet they are unable to form biliary tubes, revealing an instructive role of the vasculature in liver development. These findings uncover the cellular basis for the defining feature of AGS, identify mesenchymal Jag1-dependent and -independent stages of duct development, and provide mechanistic information for the role of Jag1 in IHBD formation.


Figures

Fig. 1.
Fig. 1.
Smooth muscle deletion of Jag1, but not endothelial deletion, leads to jaundice, cholestasis and bile duct paucity. (A) Mating schema for generating J1SMKO and J1ECKO mice. (B) J1SMKO exhibited jaundice and growth retardation from birth. (C) J1ECKO mice were viable and normal in size and appearance. (D) Kaplan-meier survival analysis of newborn J1SMKO mice. (E) Weight (mean, in grams) of J1SMKO, J1ECKO and J1WT+Het mice. Bars indicate s.e.m. (F) (Top) Livers of J1SMKO mice showed hemorrhage (chevrons) and bile deposits (open arrows). (Middle) Hematoxylin and Eosin staining of P7 livers revealed bile ducts in J1WT and J1ECKO mice (arrows), and a lack of patent bile ducts (arrowhead), as well as necrosis (broken white line, open arrow), in J1SMKO mice. (Bottom) Cytokeratin immunostaining of P25 livers indicated bilayered lumenized bile ducts in J1WT and J1ECKO (arrows) and non-lumenized ducts in J1SMKO (open arrows) mice. gb, gall bladder; pv, portal vein. Scale bars: top row, 20 mm; middle and bottom rows, 100 μm.
Fig. 2.
Fig. 2.
Loss of Jag1 in portal vein mesenchyme results in defective bile duct morphogenesis. (A-F) During IHBD development, Jag1 was found in the endothelium (arrows) of both mice, but only in the mesenchyme (asterisks) of J1WT mice. BECs (arrowheads) labeled with wide-spectrum cytokeratin (ws-CK) form a ductal plate alongside Jag1-positive PVM, while the J1SMKO liver had not yet formed this structure (E). At P3, the J1WT liver displayed a well-formed bile duct and Jag1 expression (C, arrows) remained in the endothelium, PVM and BECs. J1SMKO mice lack patent duct formation and showed a single layer of ws-CK positive cells that resembled the primitive ductal plate (pdp) (F, arrowheads). (G) Immunoprecipitation of Jag1 in whole liver lysates from J1WT and J1SMKO mice at E14.5, E16.5 and E18.5. Ns, non-specific band. (H) Western blot of isolated endothelium, BECs and PVM from P3 J1WT and J1SMKO livers. (I-L′) Jag1 expression (in red) alone in the endothelium and PVM, and co-localized with ws-CK (green) in BECs (I′,J′, arrowheads) of E18.5 and P3 J1WT livers. (J′,J′) Jag1-positive PVM (asterisks) at P3 (J′ is a higher magnification of J′). (K,K′) J1SMKO livers maintain Jag1 expression in the endothelium, but no staining was seen in the PVM or the BECs. (L′,L′) At P3, J1SMKO livers showed Jag1 colocalized with ws-CK in the disorganized BECs (arrowheads), but absent from PVM (L′ is a higher magnification of L′, bracket). bd, bile duct; bec, biliary epithelial cell; dp, ductal plate; en, endothelium; ha, hepatic artery; pdp, primitive ductal plate; pv, portal vein; pvm, portal vein mesenchyme. Scale bars: 50 μm.
Fig. 3.
Fig. 3.
Specificity of Cre expression in developing livers. (A-D) SM22-Cre;R26R double transgenic mice were used to trace Cre activity (β-gal staining, blue) during bile duct morphogenesis (cytokeratin, black). At E15.5, BECs (B,B′, arrowheads) aggregate near β-gal-positive mesenchymal cells that form the primitive ductal plate. By E18.5, a few lumenized bile ducts (C,C′, arrows) form within the mesenchyme (red bracket) and continue to develop at P3 (D,D′, arrows). (E) Western blot for Cre on liver lysates from SM22-Cre;R26R and control mice. Non-specific bands (arrowhead) indicate loading. (F) Sequential sections of SM22Cre;Rosa26R E18.5 (F,F′) livers with and without ws-CK staining. Arrowheads indicate BECs. (G-I) Mesenchymal layer thickness was decreased in J1SMKO livers compared with heterozygous littermates (brackets), and BEC organization was similar to the primitive ductal plate (H, arrowhead). In J1ECKO livers, the endothelium (I, open arrows), but not the mesenchyme, was β-gal positive. (J) SM22-Cre;R26R adults show persistence of β-gal staining in both endothelial and smooth muscle cells (open arrows), as well as the PVM (red bracket) surrounding mature bile ducts (arrows). ha, hepatic artery; pv, portal vein; Std, molecular weight standard. Scale bars: 100 μm in A-D; 50 μm in A′-D′,F-J.
Fig. 4.
Fig. 4.
Expression of Sox9 in J1SMKO livers is affected by the loss of Jag1. (A-J) Immunostaining revealed delayed onset and reduced numbers of Sox9-positive cells (arrows) in J1SMKO mice in embryonic and neonatal livers compared with J1WT mice. (K-R) Hes1 expression (arrows) at E16.5 (N) was present in both J1WT and J1SMKO CK19-positive populations, but was still in the single layer in the disorganized BECs of E18.5 J1SMKO livers (R). bd, bile duct; pv, portal vein.
Fig. 5.
Fig. 5.
Loss of Jag1 halts biliary duct tubulogenesis. (A-B′) Cytokeratin 8 (CK8) in P10 J1WT and J1SMKO livers (higher magnifications in A′,B′). CK8-positive BECs formed ducts in J1WT livers (arrows), while J1SMKO BECs (arrowheads) did not. (C) FACS analysis of P0 livers from J1WT, J1SMHet and J1SMKO mice show a decrease number of BECs in J1SMKO mice at P10-11. Bars represent mean±s.e.m. *P<0.05 (n=3-7 animals per time point). (D) Western blot of E16.5 and P0 sorted BECs from J1WT and J1SMKO livers. E-cadherin (E-cad), CK8 and cytokeratin 19 (CK19) were increased in both mice at P0 in relation to E16.5. α-Enolase was used for loading control. (E) Fluorescent immunostaining of CK8 (red) and TOPRO3 (blue) in J1WT livers at E18.5 and P10. CK8 expression was initially present along the portal side (arrowheads), but expanded when both epithelial layers were present. Keratin filaments in BECs were bundled and visible at E18.5 (open arrows). By P10, BECs were organized into ducts and CK8 expression circumscribed the cells (arrows). (F,G) Ws-CK, (green) colocalized with CK8 and CK19 in J1WT P10 livers (arrows, fourth panels). By contrast, CK8 expression was widespread and did not fully overlap with ws-CK (F, arrowheads) in J1SMKO livers. CK19 expression in J1SMKO livers was present (G) on the portal side of the BEC layer and not on the parenchymal layer where ws-CK was expressed (arrowheads). CK8 and CK19 keratin filaments were less compacted and organized in J1SMKO BECs (open arrows). pv, portal vein; nt, necrotic tissue. Scale bars: 100 μm in A,B; 50 μm in A′,B′; 50 μm in E (first and third panels); 10 μm in E (second and fourth panels); 50 μm in F,G; 10 μm in F,G (fourth panels).
Fig. 6.
Fig. 6.
Jag1 in the PVM is required for BEC spheroid formation. (A) Western blot of Jag1 in PVM cultures from mutant and control mice. (B) Two-dimensional co-cultures containing BECs and PVM do not form spheroids, but 3D co-cultures with PVM, not with dermal fibroblasts (DF) induce clustering of BECs (arrowhead). (C) Wild-type BECs cultured with J1WT PVM form spheroids (arrows), but failed to compact when co-cultured with J1SMKO PVM. (D) Quantification of spheroids from multiple cultures (n=5 independent cultures). *P≤0.001; error bars represent ±s.e.m. (E-G′) Immunostaining of the 3D cultures showed expression of BEC differentiation markers (ws-CK or CK19, in green). Wild-type BECS cultured with J1SMKO PVM did not form large spheroids, but did show smaller cell aggregates that expressed ws-CK (open arrow), similar to the clumps of cells around the portal vein seen in vivo (arrows). Scale bars: 100 μm in B,C,F; 50 μm in E-G,G′; 10 μm in E′,F′.
Fig. 7.
Fig. 7.
Temporal requirement of Jag1 signaling for morphogenesis of bile ducts. (A) Notch signaling blockade in wild-type co-cultures of PVM and BECs (at E16.5 and P2) with DAPT prevents spheroid formation (arrows) at E16.5 but not at P2. (B) Western blot demonstrates Notch2 activation within BECs after binding to Jag1 peptide (Fc, control). Black arrow indicates intact Notch2; black arrowhead indicates cleaved Notch2. When cultured with J1SMKO PVM, E16.5 BECs previously activated with soluble Jag1 peptide regained the ability to form spheroids (arrows), whereas BECs treated with Fc control peptide did not. Scale bars: 100 μm in A,B.
Fig. 8.
Fig. 8.
Spatial and temporal requirement of Jag1 during IHBD development. BEC specification and initial ductal plate formation occurs in a mesenchymal Jag1-independent manner (steps 1 and 2). Jag1 expression in the PVM controls the complete formation of the second layer of the ductal plate, allowing the BECs to eventually remodel into a lumenized duct. Expansion of PVM also appears to be dependent on Jag1 signaling (steps 3 and 4). Loss of Jag1 expression in the PVM causes duct development to stall midway during ductal plate morphogenesis (step 3), leading to a paucity of bile ducts.

References

    1. Alagille D., Estrada A., Hadchouel M., Gautier M., Odievre M., Dommergues J. P. (1987). Syndromic paucity of interlobular bile ducts (Alagille syndrome or arteriohepatic dysplasia): review of 80 cases. J. Pediatr. 110, 195-200 - PubMed
    1. Alva J. A., Zovein A. C., Monvoisin A., Murphy T., Salazar A., Harvey N. L., Carmeliet P., Iruela-Arispe M. L. (2006). VE-Cadherin-Cre-recombinase transgenic mouse: a tool for lineage analysis and gene deletion in endothelial cells. Dev. Dyn. 235, 759-767 - PubMed
    1. Antoniou A., Raynaud P., Cordi S., Zong Y., Tronche F., Stanger B. Z., Jacquemin P., Pierreux C. E., Clotman F., Lemaigre F. P. (2009). Intrahepatic bile ducts develop according to a new mode of tubulogenesis regulated by the transcription factor SOX9. Gastroenterology 136, 2325-2333 - PMC - PubMed
    1. Artavanis-Tsakonas S., Rand M. D., Lake R. J. (1999). Notch signaling: cell fate control and signal integration in development. Science 284, 770-776 - PubMed
    1. Battle M. A., Konopka G., Parviz F., Gaggl A. L., Yang C., Sladek F. M., Duncan S. A. (2006). Hepatocyte nuclear factor 4alpha orchestrates expression of cell adhesion proteins during the epithelial transformation of the developing liver. Proc. Natl. Acad. Sci. USA 103, 8419-8424 - PMC - PubMed

Publication types

MeSH terms