. 2010 Nov;22(11):3710-25.
doi: 10.1105/tpc.110.079202. Epub 2010 Nov 9.

The FtsH protease heterocomplex in Arabidopsis: dispensability of type-B protease activity for proper chloroplast development

Affiliations

The FtsH protease heterocomplex in Arabidopsis: dispensability of type-B protease activity for proper chloroplast development

Di Zhang et al. Plant Cell. 2010 Nov.

Abstract

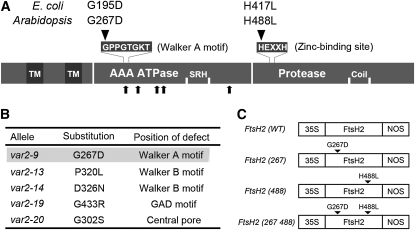
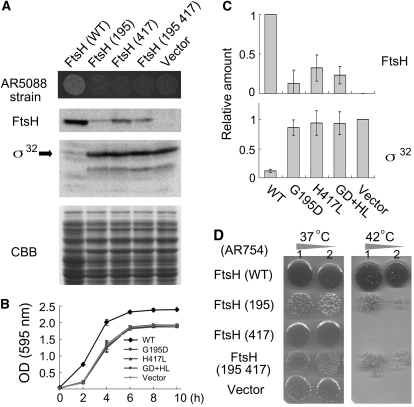
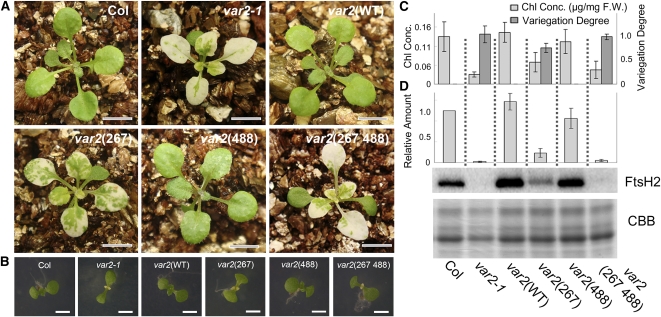
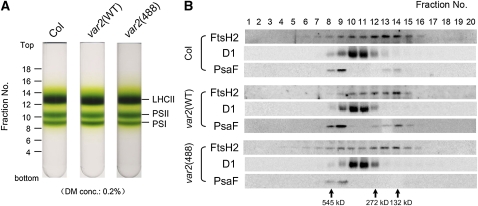
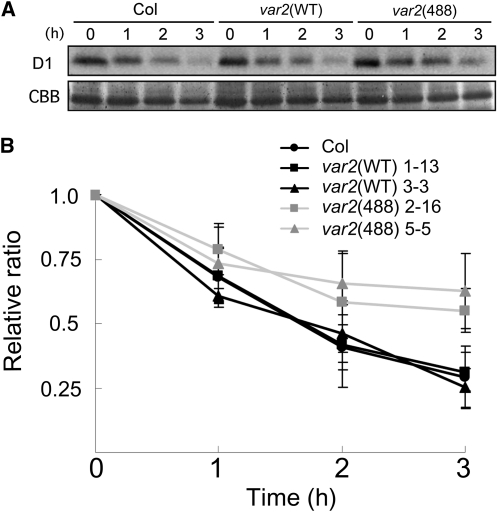
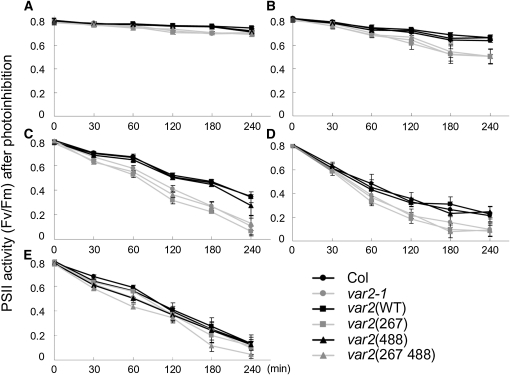
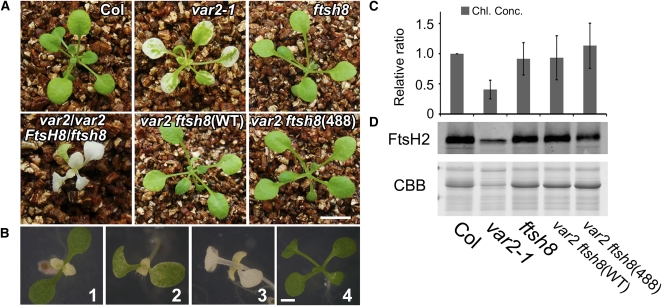
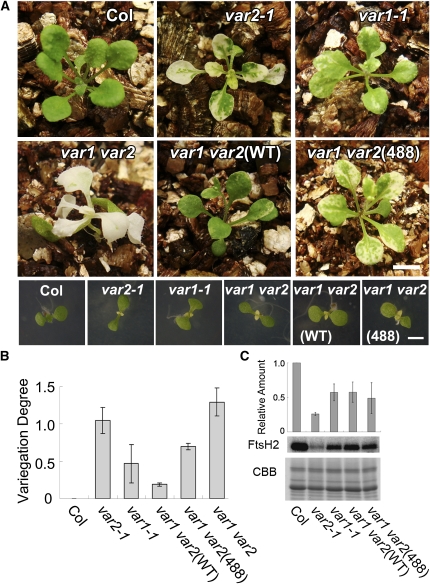
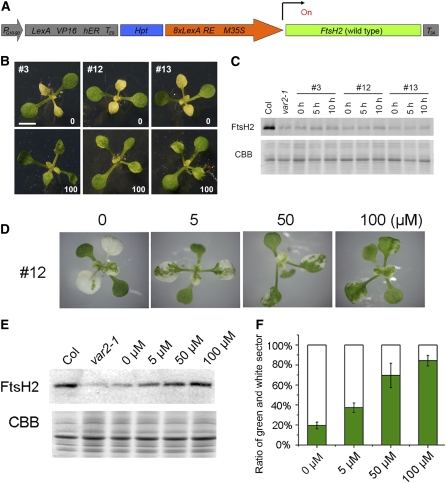
FtsH is an ATP-dependent metalloprotease present as a hexameric heterocomplex in thylakoid membranes. Encoded in the Arabidopsis thaliana YELLOW VARIEGATED2 (VAR2) locus, FtsH2 is one isoform among major Type A (FtsH1/5) and Type B (FtsH2/8) isomers. Mutants lacking FtsH2 (var2) and FtsH5 (var1) are characterized by a typical leaf-variegated phenotype. The functional importance of the catalytic center (comprised by the zinc binding domain) in FtsH2 was assessed in this study by generating transgenic plants that ectopically expressed FtsH2(488), a proteolytically inactive version of FtsH2. The resulting amino acid substitution inhibited FtsH protease activity in vivo when introduced into Escherichia coli FtsH. By contrast, expression of FtsH2(488) rescued not only leaf variegation in var2 but also seedling lethality in var2 ftsh8, suggesting that the protease activity of Type B isomers is completely dispensable, which implies that the chloroplastic FtsH complex has protease sites in excess and that they act redundantly rather than coordinately. However, expression of FtsH2(488) did not fully rescue leaf variegation in var1 var2 because the overall FtsH levels were reduced under this background. Applying an inducible promoter to our complementation analysis revealed that rescue of leaf variegation indeed depends on the overall amount of FtsH. Our results elucidate protein activity and its amount as important factors for the function of FtsH heterocomplexes that are composed of multiple isoforms in the thylakoid membrane.


Figures

Figure 1.
Figure 1.
Summary of Amino Acid Substitutions Introduced into FtsH2. (A) Schematic view of FtsH/FtsH2 protein in E. coli and Arabidopsis. The protein sequence is shown as a horizontal bar with illustrations of the transmembrane domain (TM), ATPase domain (AAA ATPase), second region of homology (SRH), Zn2+ metalloprotease domain (Protease), and coiled-coil region (Coil). The N-terminal variation between E. coli and Arabidopsis is not included. The conserved amino acid sequences for the Walker A motif and zinc binding site are shown above the protein sequence. The amino acid substitutions characterized in this study are also shown. Five other amino acid substitutions identified from different alleles (B) are indicated below the protein sequence by arrows. (B) Amino acid substitutions in var2 alleles. The amino acid substitution in var2-9 (highlighted) is identical to that in (A) (G267D). (C) Schematic representation of gene constructs used for this study. 35S, CaMV 35S promoter; NOS, nopaline synthase terminator. Amino acid substitutions are indicated by arrowheads.
Figure 2.
Figure 2.
Inhibition of Protease Activity in E. coli FtsH with Amino Acid Substitutions. (A) In vivo protease activity of wild-type and mutant FtsH proteins in E. coli. AR5088 (sfhC ΔftsH) was transformed with pIFH108 containing wild-type FtsH (WT) or containing mutated FtsHs (G195D, H417L, or G195D+H417L). Vector indicates an empty vector without FtsH. Cells harboring plasmids of mutated FtsHs (G195D, H417L, and G195D+H417L) or without FtsH displayed smaller colonies, reflecting deficient growth (top panel). Immunoblots of E. coli extracts with anti-FtsH and anti-σ32 (a substrate of FtsH) are shown together with the CBB-stained gel image of the same samples. (B) Growth curves of E. coli AR5088. Cells transformed with empty vector pER15b (Vector) or with pIFH108 expressing wild-type FtsH or mutated FtsHs (G195D, H417L, and G195D+H417L [abbreviated as GD+HL]) were grown in LB medium. Cell densities of bacteria were measured according to photometric detection with OD (595 nm) readings (bars represent sd; five biological repeats). (C) Relative amounts of FtsH and σ32 estimated by immunoblotting (bars represents sd; six biological repeats). To normalize the expression values, the pIFH108 (WT) and empty vector control values were set to 1 for FtsH and σ32, respectively (D) Complementation of ftsH1 (Ts) by wild-type and mutated FtsH proteins. ftsH1 (AR754) is a temperature-sensitive mutant that was transformed with pIFH108 containing FtsH (WT), FtsH (195), FtsH (417), or FtsH (195 417) or without an insert (Vector). Growth of each strain on LB agar at 37°C (left) and 42°C (right) is shown. Rows 1 and 2 present data of 1-fold and 10-fold dilutions of cultures, respectively.
Figure 3.
Figure 3.
Complementation Analysis of var2 with Wild-type and Mutated FtsH2. (A) Photographs of 3-week-old Col, var2-1, var2(WT), var2(267), var2(488), and var2(267 488). Bars = 6 mm. (B) Photographs of 8-d-old Col, var2-1, var2(WT), var2(267), var2(488), and var2(267 488). Cotyledons are normal in all lines. The first pair of true leaves displayed variegation in var2-1, var2(267), and var2(267 488) but not in Col, var2(WT), and var2(488). Bars = 3 mm. (C) Evaluation of leaf variegation by chlorophyll content and digital imaging. Chlorophyll concentrations (Chl Conc.) of 3-week-old seedlings are shown based on fresh weight (F.W.). The degree of leaf variegation was estimated from images of the leaves as described in Methods. Data were generated from three biological replicates (bars represent sd). (D) Immunoblot analysis of FtsH2. Total proteins from 3-week-old seedlings were probed with anti-FtsH2 (normalized by fresh weight). A CBB-stained gel of the samples is shown on the bottom. Relative levels of FtsH2 (normalized by LHCII, and Col was adjusted as 1) are shown on the top (bars represent sd; data were obtained from five biological replicates).
Figure 4.
Figure 4.
Sucrose Density Gradient Analysis of Thylakoid Membrane Proteins. (A) Photographs of 0.1 to 1.3 M sucrose density gradients. Thylakoid membranes from Col, var2(WT), and var2(488) were solubilized using 0.2% DM. Relative positions of the fractions and the locations of LHCII monomer/trimer (LHCII), PSII monomer (PSII), and photosystem I complex (PSI) are indicated. (B) Immunoblot analysis of the sucrose density gradient fractions. The fractions were collected from the tubes of the sucrose density gradients shown in (A). Equal amounts of the fractions were subjected to SDS-PAGE and probed with anti-FtsH2, anti-D1, and anti-PsaF. Immunoblot analysis data from Col, var2(WT), and var2(488) are shown.
Figure 5.
Figure 5.
In Vivo D1 Degradation Assay under High-Light Irradiation. (A) Immunoblot analysis. Total proteins from Col, var2(WT), and var2(488) leaf discs (8 weeks) were incubated with anti-D1 (top panel). The CBB-stained gel of the same samples (in the area corresponding to LHC) is shown on the bottom. Prior to extraction, discs were infiltrated with 5 mM lincomycin and placed under high light (1200 μmol photons m−2 s−1) for 3 h. (B) Relative ratio of D1 levels during high-light irradiation shown in (A). D1 levels were estimated from immunoblots and normalized based on the CBB-stained LHC (bars indicate sd; n = 5; five biological replicates). The ratio at 0 h was adjusted to 1. Calculations from two independent transgenic lines are presented for var2(WT) (lines 1-13 and 3-3) and var2(488) (lines 2-16 and 5-5).
Figure 6.
Figure 6.
Measurement of PSII Activity Estimated Using Chlorophyll Fluorescence during High-Light Irradiation. (A) to (D) Relative ratio of PSII activity without lincomycin. Mature leaf discs from Col, var2-1, var2(WT), var2(267), var2(488), and var2(267 488) were exposed to low light (250 μmol photons m−2 s−1) (A), moderate light (500 μmol photons m−2 s−1) (B), high light (1000 μmol photons m−2 s−1) (C), or strong light (1500 μmol photons m−2 s−1) (D); the maximum photochemical efficiency (Fv/Fm) was measured at 0, 30, 60, 120, 180, and 240 min after irradiation (mean ± sd; data were obtained from five biological replicates). (E) An identical experiment to that described in (C) under strong light (1500 μmol photons m−2 s−1) except plants were infiltrated with lincomycin prior to irradiation, as shown in Figure 5.
Figure 7.
Figure 7.
Complementation Analysis of var2 ftsh8 with Wild-type and Mutated FtsH2. (A) Photographs of 3-week-old Col, var2-1, ftsh8, var2/var2 FtsH8/ftsh8, var2 ftsh8(WT), and var2 ftsh8 (488). Not only FtsH(WT) but also FtsH2(488) rescues seedling lethality of var2 ftsh8. Bars = 6 mm. (B) Photographs of 8-d-old var2 (1), var2/var2 FtsH8/ftsh8 (2), var2 ftsh8 (3), and var2 ftsh8(488) (4) plants. Bars = 3 mm. (C) Chlorophyll content of 3-week-old seedlings (estimated based on fresh weight). The relative ratios of chlorophyll concentrations (Chl. Conc.) were adjusted according to Col (Col was set to 1). Data were generated from five biological replicates (bars represent sd). (D) Immunoblot analysis of FtsH2. Total proteins from 4-week-old seedlings were probed with anti-FtsH2 (normalized by fresh weight). A CBB-stained gel of the samples is shown on the bottom. The experiment was repeated five times, with results obtained from five biological replicates.
Figure 8.
Figure 8.
Complementation Analysis of var1 var2 with Wild-Type and Mutated FtsH2. (A) Photographs of 3-week-old (top panels) and 8-d-old (bottom panels) Col, var2-1, var1-1, var1 var2, var1 var2(WT), and var1 var2(488). Bars = 6 mm in the top panels and 3 mm in the bottom panels. (B) Evaluation of leaf variegation using digital image analysis. The degree of leaf variegation of the first three true leaves (at 3 weeks) was estimated as described in Methods. The value was estimated from three independent experiments (bars indicate sd; n = 3) and normalized according to Col (Col was set to 0). (C) Immunoblot analysis of FtsH2. Total proteins from 3-week-old seedlings were probed with anti-FtsH2 antisera (normalized by fresh weight). A CBB-stained gel of the samples is shown on the bottom. Relative levels of FtsH2 (normalized by LHCII; Col was set to 1) are shown at the top (bars represent sd; data from three biological repeats).
Figure 9.
Figure 9.
Rescue of Leaf Variegation in var2 by Inducible Expression of FtsH2(WT). (A) Schematic diagram of the pER8-FtsH2(WT) construct. The region corresponding to the T-DNA region is shown. FtsH2 cDNA (shown in green) was cloned between the target promoter (8xLexA RE M35S, shown as an orange arrow) and rbcS3A poly(A) addition sequence (T3A, shown in gray). The chimeric gene (LexA VP16 hER TE9 shown in gray) is constitutively expressed by the PG10-90 promoter (gray arrow) and transactivates FtsH2(WT) in an estradiol dose-dependent manner. Hpt (shown in blue) indicates hygromycin-resistant gene as a selectable marker. (B) Photographs of pER8-var2(WT) transgenic lines grown on Murashige and Skoog plates. Three independent lines (#3, #12, and #13) were sown on hygromycin plates with or without supplementation of 100 μM 17-β-estradiol (shown as 0 or 100, respectively). Representative plants are shown 14 d after sowing. Bar = 6 mm. (C) Induction of FtsH2 in excised mature leaves from pER8-var2(WT). Leaflets from the three pER8-var2(WT) lines were incubated on 100 μM 17-β-estradiol solution for 0, 5, and 10 h (as shown on the immunoblot). Three leaflets were collected and subjected to immunoblot analysis with FtsH2 antisera (top panel). A CBB-stained gel of the samples (in the area corresponding to LHC) is shown on the bottom panel (samples were normalized based on fresh weight). Experiments were performed with four biological repeats. (D) Rescue of leaf variegation in pER8-var2(WT) with different concentrations of 17-β-estradiol. Photographs of plants from line #12 with 0, 5, 50, or 100 μM 17-β-estradiol are shown. (E) Induction of FtsH2 correlates with 17-β-estradiol concentration. Immunoblots of total proteins from line #12 grown in different concentrations of 17-β-estradiol (shown on top of the blot) were probed with anti-FtsH2 antisera (samples were normalized by chlorophyll content). A CBB-stained gel of the samples (in the area corresponding to LHC) is shown at the bottom. Experiments were performed with three biological repeats. (F) Degree of leaf variegation in pER8-var2(WT) #12 lines grown in different concentrations of 17-β-estradiol (bars represent sd; data from 10 leaves with five different individuals).

Similar articles

Cited by

References

    1. Adam Z., Rudella A., van Wijk K.J. (2006). Recent advances in the study of Clp, FtsH and other proteases located in chloroplasts. Curr. Opin. Plant Biol. 9: 234–240 - PubMed
    1. Aluru M.R., Yu F., Fu A., Rodermel S. (2006). Arabidopsis variegation mutants: New insights into chloroplast biogenesis. J. Exp. Bot. 57: 1871–1881 - PubMed
    1. Bailey S., Thompson E., Nixon P.J., Horton P., Mullineaux C.W., Robinson C., Mann N.H. (2002). A critical role for the Var2 FtsH homologue of Arabidopsis thaliana in the photosystem II repair cycle in vivo. J. Biol. Chem. 277: 2006–2011 - PubMed
    1. Baker T.A., Sauer R.T. (2006). ATP-dependent proteases of bacteria: recognition logic and operating principles. Trends Biochem. Sci. 31: 647–653 - PMC - PubMed
    1. Begg K.J., Tomoyasu T., Donachie W.D., Khattar M., Niki H., Yamanaka K., Hiraga S., Ogura T. (1992). Escherichia coli mutant Y16 is a double mutant carrying thermosensitive ftsH and ftsI mutations. J. Bacteriol. 174: 2416–2417 - PMC - PubMed

Publication types

MeSH terms

LinkOut - more resources