. 2010 Dec 1;123(Pt 23):4170-81.
doi: 10.1242/jcs.068387. Epub 2010 Nov 9.

Agonist-activated Ca2+ influx occurs at stable plasma membrane and endoplasmic reticulum junctions

Affiliations

Agonist-activated Ca2+ influx occurs at stable plasma membrane and endoplasmic reticulum junctions

Susan Treves et al. J Cell Sci. .

Abstract

Junctate is a 33 kDa integral protein of sarco(endo)plasmic reticulum membranes that forms a macromolecular complex with inositol 1,4,5-trisphosphate [Ins(1,4,5)P(3)] receptors and TRPC3 channels. TIRF microscopy shows that junctate enhances the number of fluorescent puncta on the plasma membrane. The size and distribution of these puncta are not affected by the addition of agonists that mobilize Ca(2+) from Ins(1,4,5)P(3)-sensitive stores. Puncta are associated with a significantly larger number of peripheral junctions between endoplasmic reticulum and plasma membrane, which are further enhanced upon stable co-expression of junctate and TRPC3. The gap between the membranes of peripheral junctions is bridged by regularly spaced electron-dense structures of 10 nm. Ins(1,4,5)P(3) inhibits the interaction of the cytoplasmic N-terminus of junctate with the ligand-binding domain of the Ins(1,4,5)P(3) receptor. Furthermore, Ca(2+) influx evoked by activation of Ins(1,4,5)P(3) receptors is increased where puncta are located. We conclude that stable peripheral junctions between the plasma membrane and endoplasmic reticulum are the anatomical sites of agonist-activated Ca(2+) entry.


Figures
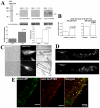
Fig. 1.
Fig. 1.
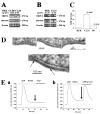
Characterization of HEK clone 21 stably overexpressing junctate–YFP. (A) The total cell extract of clone 21 (CL21) was resolved by 10% SDS-PAGE, blotted onto nitrocellulose and probed with mouse anti-GFP (left). Microsomal proteins (50 μg/lane) from HEK293 cells or HEK CL21 cells were separated by 7.5% SDS-PAGE, blotted onto nitrocellulose and incubated with the indicated anti-InsP3R antibody. Control for equal loading was performed by probing the blot with anti-tubulin antibodies. The histograms on the left show the mean intensity of the immunopositive bands corresponding to the lower InsP3R3 band (corrected for β-tubulin content). Bars represent means of five experiments ± s.e.m. The histograms on the right show the relative content of InsP3R3 transcript as assessed by real-time RT-PCR (mean ± s.e.m. of three experiments). (B) HEK293 junctate–YFP clone 21 cells were loaded with the fluorescent Ca2+ indicator Fura-2 and the peak Ca2+ transient obtained after addition of 100 μM ATP or 400 nM thapsigargin was determined in Ca2+-free Krebs-Ringer containing 0.5 mM EGTA. Results represent the mean (±s.e.m.) peak fluorescence increase (peak ratio – resting ratio) of 1×10⁶ cells/ml (n=5–6 independent determinations). (C) HEK293 junctate–YFP (clone 21, top) or HEK cells transiently transfected with the ER-tagged fluorescent protein SScalEGFP (bottom) were visualized under bright-field illumination (left), by epifluorescence (central), with a SRIC filter to identify the coverslip cell contact site (right) or by TIRF (D) at the focal plane identified with the SRIC filter. Top panel shows membrane fluorescence of HEK junctate–YFP cells showing that the fluorescence on the PM appears as distinct puncta, whereas cells expressing the ER-targeted GFP fusion protein show a ‘wormlike’ fluorescence on some areas of the PM. (E) Indirect immunofluorescence analysis of junctate and InsP3R3 in HEK junctate–YFP cells. Cells were incubated with goat anti-InsP3R3 followed by anti-goat DyLighte Fluor-405 and rabbit anti-GFP Alexa Fluor 488. The focal plane next to the plasma membrane was identified with the SRIC filter and GFP fluorescence was visualized through a 100× TIRF objective. For detection of the InsP3R, excitation was at 405 nm and emission was visualized at 427 nm using a brightline HC 427/10 filter. Images were merged using the Metamorph software and overlapping pixels (arrows) are shown in orange.
Fig. 2.
Fig. 2.
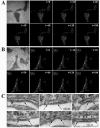
HEK293 junctate–YFP cells show discrete puncta on the plasma membrane and exhibit increased number of ER–PM junctions. (A) HEK-junctate–YFP cells were visualized with a SRIC filter (top left panel) and then by TIRF microscopy. Panels show successive time-lapse series of the same cells after stimulation with 100 μM ATP in Krebs-Ringer containing 2 mM Ca2+.(B) As for A, except that HEK cells were transiently transfected with the ER-resident protein SScalEGFP. Note the absence of movement of the puncta. Cells were visualized with a 100× TIRF objective (1.49 NA) and were illuminated with a Sapphire laser. Scale bar: 10 μm. (C) Peripheral couplings in junctate–YFP clones. Electron micrographs showing that the endoplasmic reticulum and plasma membrane form junctions (between arrows) of variable length.
Fig. 3.
Fig. 3.
Characteristics of HEK junctate and HEKT3 junctate overexpressing clones. Total RNA was extracted from HEK T3 and HEK T3-junctate clone D6 cells (A) or from control HEK293 and HEK293 junctate–YFP clone 21 cells (B) and converted into cDNA and amplified. (C) Real-time PCR analysis for quantification of junctate in HEK293 cells, clone 21 and clone D6; bars represent mean (±s.e.m.; n=4) fold increase of junctate transcript. (D) Peripheral couplings in HEK T3-junctate clone D6. Electron micrographs showing that the endoplasmic reticulum and plasma membrane form junctions (between arrows) of variable length. (E) Fura-2-loaded HEKT3 junctate clone D6 cells were stimulated as indicated. Small arrow shows addition of 2 mM Ca2+ (a). Large arrow shows addition of 2 mM Ca2+ plus 100 μM ATP (b). Results are representative of experiments carried out on 20 cells. ATP, 100 μM ATP; EGTA, Krebs-Ringer containing 0.5 mM EGTA; Ca2+, Krebs-Ringer containing 2 mM Ca2+; ATP in Ca2+, 100 μM ATP in 2 mM Ca2+.
Fig. 4.
Fig. 4.
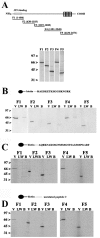
Identification of the InsP3R domains involved in the interaction with the N-terminus of junctate. (A) Schematic representation (top) and autoradiography (bottom) of an aliquot (5 μl) of the [35S]Met-labelled overlapping in vitro transcribed and translated InsP3R3 fragments separated by 10% SDS-PAGE. Streptavidin-coated beads coated with a biotinylated peptide corresponding to the N-terminus of junctate (B), aspartyl-β-hydroxylase (C) and an unrelated peptide (D) were incubated with the InsP3R overlapping fragments F1–F5. Proteins present in the void (V), last wash (LW) and bound (B) to the beads were separated by 10% SDS-PAGE, gels were dried and exposed overnight to an X-ray film. Experiments were carried out at least four times with identical results.
Fig. 5.
Fig. 5.
The interaction between InsP3R F1 and the peptide encompassing the N-terminus of junctate is influenced by InsP3 but it does not significantly affect InsP3 binding to microsomes from HEK293 cells. (A) Streptavidin-coated beads incubated with the biotinylated peptide encompassing the junctate N-terminus, were incubated with [35S]Met in vitro transcribed and translated F1 peptide (residues 1–686 of the human InsP3R3), in the presence of the indicated concentration of InsP3 (0–10 μM) or 10 μM ATP (control). Bound proteins were eluted by incubating the beads with 5% SDS and boiling the samples for 5 minutes. The supernatant was separated by 10% SDS-PAGE, the gel was dried and exposed to an X-ray film. The intensity of the bands corresponding to F1 were quantified by densitometry using Bio-Rad GelDoc 2000 and are plotted in the lower panel of Fig. 2B. 100% represents the intensity of the F1 band obtained in the absence of competing InsP3. Bars represent the mean ± s.e.m. of five measurements. (B) InsP3 binding to microsomes from HEK293 cells in the presence of 50 μM N-terminal junctate peptide (closed squares) or in the presence of an unrelated peptide (open circles). Results show the mean amount of InsP3 bound (fmoles/mg protein) ± s.e.m. of 4–8 determinations.
Fig. 6.
Fig. 6.
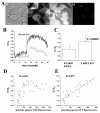
Changes in [Ca2+]i occur within domains of the plasma membrane enriched in junctate. (A) Fura-Red-loaded HEK junctate–YFP (clone 21) cells were visualized (a) by bright-field, (b) by epifluorescence, (c) with a surface reflection interference contrast filter and (d) by TIRF microscopy (488 nm excitation, 510 nm emission). Scale bar: 10 μm. (B) Changes in the intracellular Ca2+ concentration of junctate–YFP clone 21 cells were visualized by TIRF microscopy following the changes in fluorescence of Fura Red (405 nm excitation, 625/640 nm emission) within the YFP-positive puncta, induced by the addition of 100 μM ATP in Krebs-Ringer containing 0.5 mM EGTA (dotted line) or by the addition of 100 μM ATP in Krebs-Ringer containing 2 mM Ca2+ (continuous line). The traces in B show the change in the Ca2+-dependent Fura Red fluorescence at 625 nm over time (ΔF, fluorescent value at any time point; Fo, fluorescence value at t=0). (C) Bar graph showing the mean peak increase (±s.d.) of Fura Red fluorescence induced by 100 μM ATP in the presence of 2 mM Ca2+ (n=30) or in the presence of 0.5 mM EGTA (n=28). (D,E) Linear regression analysis correlating YFP fluorescent intensity values to peak increase in Fura Red fluorescence ratio induced by 100 μM ATP in medium containing 2 mM Ca2+. In D, linear regression was calculated using all YFP fluorescent intensity values whereas in E, the analysis was made including values within 0 and 2000 fluorescent intensity units. Fluorescence analysis was performed using the Metamorph software; statistical analysis including linear regression was performed using the Origin Microcal software.

Similar articles

Cited by

References

    1. Ando H., Mitzutani A., Kiefer H., Tsuzurugi D., Michikawa T., Mikoshiba K. (2006). IRBIT suppresses IP3 receptor activity by competing with IP3 for the common binding site on the IP3 receptor. Mol. Cell 22, 795-806 - PubMed
    1. Berridge M. J. (1995). Capacitative calcium entry. Biochem. J. 312, 1-11 - PMC - PubMed
    1. Berridge M. J. (2004). Conformational coupling: a physiological calcium entry mechanism. Sci. STKE 243, pe33 - PubMed
    1. Dellis O., Dedos S. G., Tovey S. C., Ur-Rahman T., Dubel S. J., Taylor C. W. (2006). Ca2+ entry through plasma membrane IP3 receptors. Science 313, 229-233 - PubMed
    1. Eisner D. A., Trafford A. W. (2009). What is the purpose of the large sarcolemmal calcium flux on each heartbeat? Am. J. Physiol. Heart. Circ. Physiol. 297, H493-H494 - PMC - PubMed

Publication types

MeSH terms

LinkOut - more resources