. 2011 Feb 1;20(3):445-54.
doi: 10.1093/hmg/ddq491. Epub 2010 Nov 9.

Tsc2 gene inactivation causes a more severe epilepsy phenotype than Tsc1 inactivation in a mouse model of tuberous sclerosis complex

Affiliations

Tsc2 gene inactivation causes a more severe epilepsy phenotype than Tsc1 inactivation in a mouse model of tuberous sclerosis complex

Ling-Hui Zeng et al. Hum Mol Genet. .

Abstract

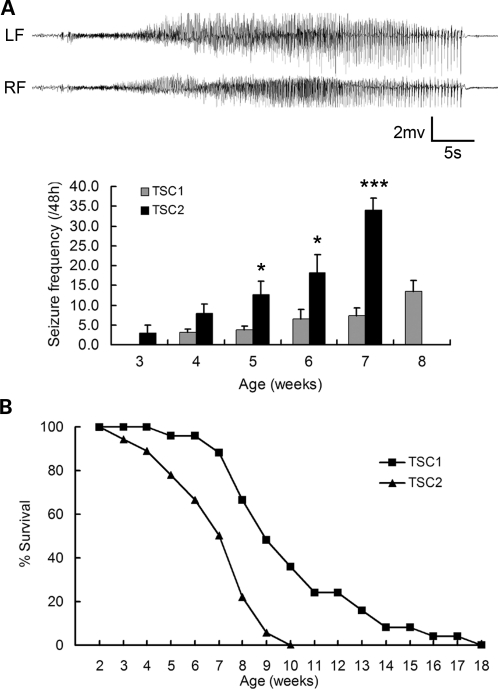
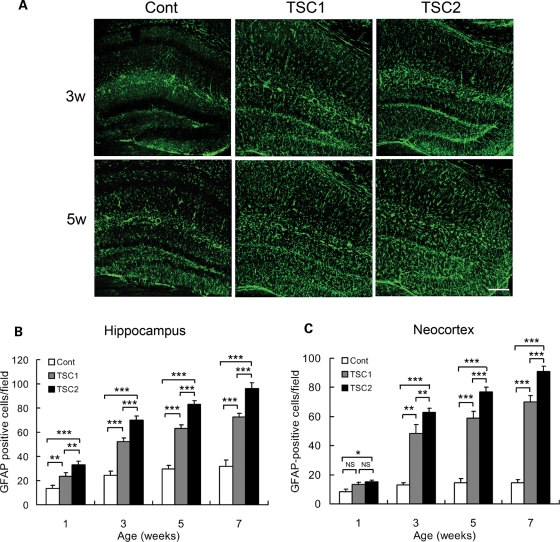
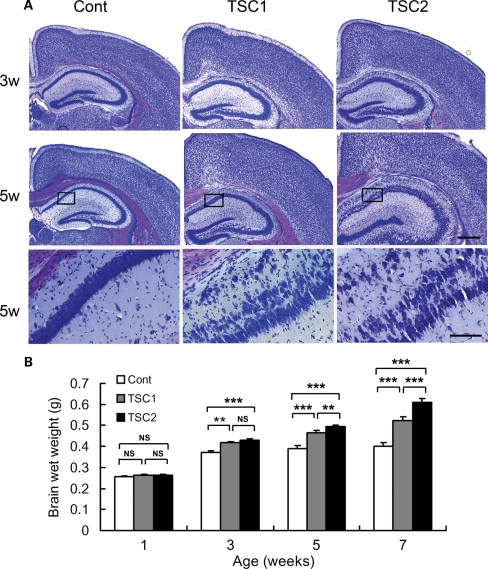
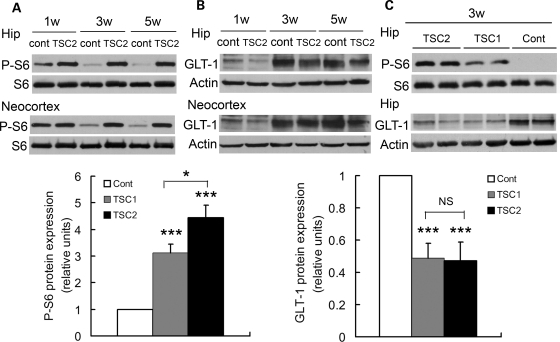
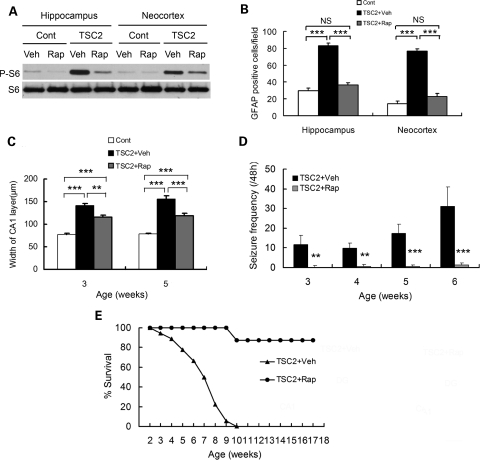
Tuberous Sclerosis Complex (TSC) is an autosomal dominant, multi-system disorder, typically involving severe neurological symptoms, such as epilepsy, cognitive deficits and autism. Two genes, TSC1 and TSC2, encoding the proteins hamartin and tuberin, respectively, have been identified as causing TSC. Although there is a substantial overlap in the clinical phenotype produced by TSC1 and TSC2 mutations, accumulating evidence indicates that TSC2 mutations cause more severe neurological manifestations than TSC1 mutations. In this study, the neurological phenotype of a novel mouse model involving conditional inactivation of the Tsc2 gene in glial-fibrillary acidic protein (GFAP)-positive cells (Tsc2(GFAP1)CKO mice) was characterized and compared with previously generated Tsc1(GFAP1)CKO mice. Similar to Tsc1(GFAP1)CKO mice, Tsc2(GFAP1)CKO mice exhibited epilepsy, premature death, progressive megencephaly, diffuse glial proliferation, dispersion of hippocampal pyramidal cells and decreased astrocyte glutamate transporter expression. However, Tsc2(GFAP1)CKO mice had an earlier onset and higher frequency of seizures, as well as significantly more severe histological abnormalities, compared with Tsc1(GFAP1)CKO mice. The differences between Tsc1(GFAP1)CKO and Tsc2(GFAP1)CKO mice were correlated with higher levels of mammalian target of rapamycin (mTOR) activation in Tsc2(GFAP1)CKO mice and were reversed by the mTOR inhibitor, rapamycin. These findings provide novel evidence in mouse models that Tsc2 mutations intrinsically cause a more severe neurological phenotype than Tsc1 mutations and suggest that the difference in phenotype may be related to the degree to which Tsc1 and Tsc2 inactivation causes abnormal mTOR activation.


Figures

Figure 1.
Figure 1.
Tsc2GFAP1CKO mice have more severe epilepsy and earlier premature death than Tsc1GFAP1CKO mice. (A) Tsc1GFAP1CKO and Tsc2GFAP1CKO mice underwent video-EEG monitoring starting at 3 weeks of age. The EEG tracings show a typical electrographic seizure from a Tsc2GFAP1CKO mice, typically characterized behaviorally by head nodding, rearing, and repetitive forelimb clonus. LFand RF, left and right frontal epidural electrodes. Seizures occur in Tsc2GFAP1CKO mice at 3 weeks and become progressively more frequent with age. Note that no Tsc2GFAP1CKO mice survived long enough in the video-EEG studies to collect seizure frequency data at 8 weeks. In contrast, in Tsc1GFAP1CKO mice, seizures do not start until at least 4 weeks of life and the seizure frequency is significantly lower than in Tsc2GFAP1CKO mice (*P< 0.05, ***P< 0.001 by ANOVA, n= 16 for Tsc2GFAP1CKO and n= 22 for Tsc1GFAP1CKO mice). (B) Both Tsc1GFAP1CKO and Tsc2GFAP1CKO mice exhibit premature death, but Tsc2GFAP1CKO die earlier than Tsc1GFAP1CKO mice (P< 0.05 by the Kaplan–Meier log-rank test, n= 18 for Tsc2GFAP1CKO and n= 25 for Tsc1GFAP1CKO mice).
Figure 2.
Figure 2.
Tsc2GFAP1CKO mice have more severe astrocyte proliferation than Tsc1GFAP1CKO mice. (A) GFAP-staining was performed in control, Tsc1GFAP1CKO and Tsc2GFAP1CKO mice at different ages. Both Tsc1GFAP1CKO and Tsc2GFAP1CKO mice exhibited a significant increase in GFAP-positive cells in hippocampus compared with control mice. Scale bar = 200 µm. (B and C) Quantitative analysis of both hippocampus and neocortex shows that the increase in GFAP-positive cells is significantly greater in Tsc2GFAP1CKO mice compared with Tsc2GFAP1CKO mice (*P< 0.05, **P< 0.01, ***P< 0.001 by ANOVA, n= 6 mice per group).
Figure 3.
Figure 3.
Tsc2GFAP1CKO mice have more severe neuronal disorganization and megencephaly than Tsc1GFAP1CKO mice. (A) Cresyl violet staining demonstrated an obvious dispersion of the pyramidal cell layer in hippocampus of both Tsc1GFAP1CKO and Tsc2GFAP1CKO compared with controls, but this was more pronounced in Tsc2GFAP1CKO mice. Scale bars = 200 µm and 100 µm for low- and high-power images, respectively. (B) Brain weight was significantly increased in both Tsc1GFAP1CKO and Tsc2GFAP1CKO mice compared with controls starting at 3 weeks of age, and was greater in Tsc2GFAP1CKO mice compared with Tsc1GFAP1CKO mice starting at 5 weeks of age (**P< 0.01, ***P< 0.001 by ANOVA, n= 6 mice per group).
Figure 4.
Figure 4.
Tsc2GFAP1CKO mice have greater mTOR hyperactivation than Tsc1GFAP1CKO mice. (A) Total S6 and phospho-S6 (P-S6) expression was measured by Western blotting in neocortex and hippocampus of control and Tsc2GFAP1CKO mice. mTOR activation, as reflected by P-S6 expression, is increased in Tsc2GFAP1CKO mice compared with controls. (B) Tsc2GFAP1CKO mice also have decreased GLT-1 expression compared with controls. (C) Although there is no difference in GLT-1 expression between Tsc1GFAP1CKO and Tsc2GFAP1CKO mice, mTOR activation is significantly greater in Tsc2GFAP1CKO mice compared with control mice Representative blots are shown. Graphs show summarized quantified data for all experiments (*P< 0.05, ***P< 0.001 by ANOVA, each experiment was repeated three times with n= 6 mice total per group).
Figure 5.
Figure 5.
The neurological phenotype of Tsc2GFAP1CKO mice is prevented by rapamycin. (A) Rapamycin inhibits mTOR activation, as reflected by P-S6 expression by Western blotting, in Tsc2GFAP1CKO mice. (B) Rapamycin prevents the increase in GFAP-positive cells in Tsc2GFAP1CKO mice (***P< 0.001 by ANOVA, n= 6 mice per group). (C) Rapamycin decreases, but does not completely prevent, the dispersion of the pyramidal cell layer in hippocampus (**P< 0.01, ***P< 0.001 by ANOVA, n= 6 mice per group). (D) Rapamycin decreases seizure frequency in Tsc2GFAP1CKO mice (**P< 0.01, ***P< 0.001 by ANOVA, n= 18 for Tsc2GFAP1CKO and n= 8 for Tsc2GFAP1CKO + Rap groups). (E) Rapamycin also prolongs survival of Tsc2GFAP1CKO mice (P< 0.05 by the Kaplan–Meier log-rank test, n= 19 for Tsc2GFAP1CKO and n= 8 for Tsc2GFAP1CKO + Rap groups).

Similar articles

Cited by

References

    1. Kwiatkowski D.J. Tuberous sclerosis: from tubers to mTOR. Ann. Hum. Genet. 2003;67:87–96. - PubMed
    1. Crino P.B., Nathanson K.L., Henske E.P. The tuberous sclerosis complex. N. Engl. J. Med. 2006;355:1345–1356. - PubMed
    1. Holmes G.L., Stafstrom C.E. and the Tuberous Sclerosis Study Group. Tuberous Sclerosis Complex and epilepsy: recent developments and future challenges. Epilepsia. 2007;48:617–630. - PubMed
    1. Jones A.C., Daniells C.E., Snell R.G., Tachataki M., Idziaszczyk S.A., Krawczak M., Sampson J.R., Cheadle J.P. Molecular genetic and phenotypic analysis reveals differences between TSC1 and TSC2 associated familial and sporadic tuberous sclerosis. Hum. Mol. Genet. 1997;6:2155–2161. - PubMed
    1. Dabora S.L., Jozwiak S., Franz D.N., Roberts P.S., Nieto A., Chung J., Coy Y.S., Reeve M.P., Thiele E., Egelhoff J.C., et al. Mutational analysis in a chort of 224 tuberous sclerosis patients indicates increased severity of TSC2, compared with TSC1, disease in multiple organs. Am. J. Hum. Genet. 2001;68:64–80. - PMC - PubMed

Publication types

MeSH terms

Substances