

Insulin-like growth factor I suppresses bone morphogenetic protein signaling in prostate cancer cells by activating mTOR signaling
- PMID: 21062988
- PMCID: PMC3285447
- DOI: 10.1158/0008-5472.CAN-10-1119
Insulin-like growth factor I suppresses bone morphogenetic protein signaling in prostate cancer cells by activating mTOR signaling
Retraction in
-
Retraction: Insulin-Like Growth Factor I Suppresses Bone Morphogenetic Protein Signaling in Prostate Cancer Cells by Activating mTOR Signaling.Cancer Res. 2020 May 1;80(9):1902. doi: 10.1158/0008-5472.CAN-20-0679. Cancer Res. 2020. PMID: 32366529 Free PMC article. No abstract available.
Abstract
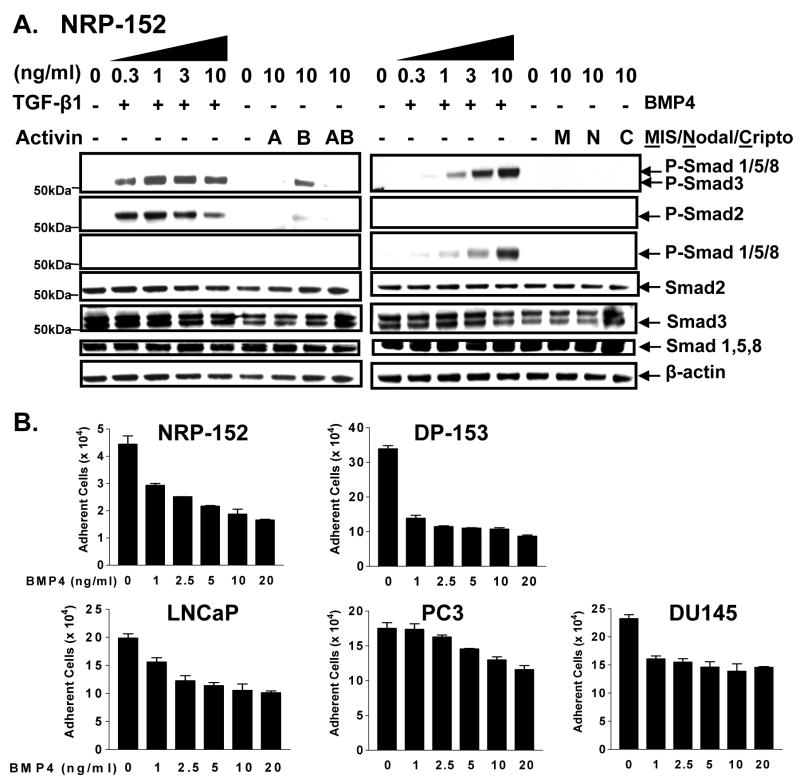
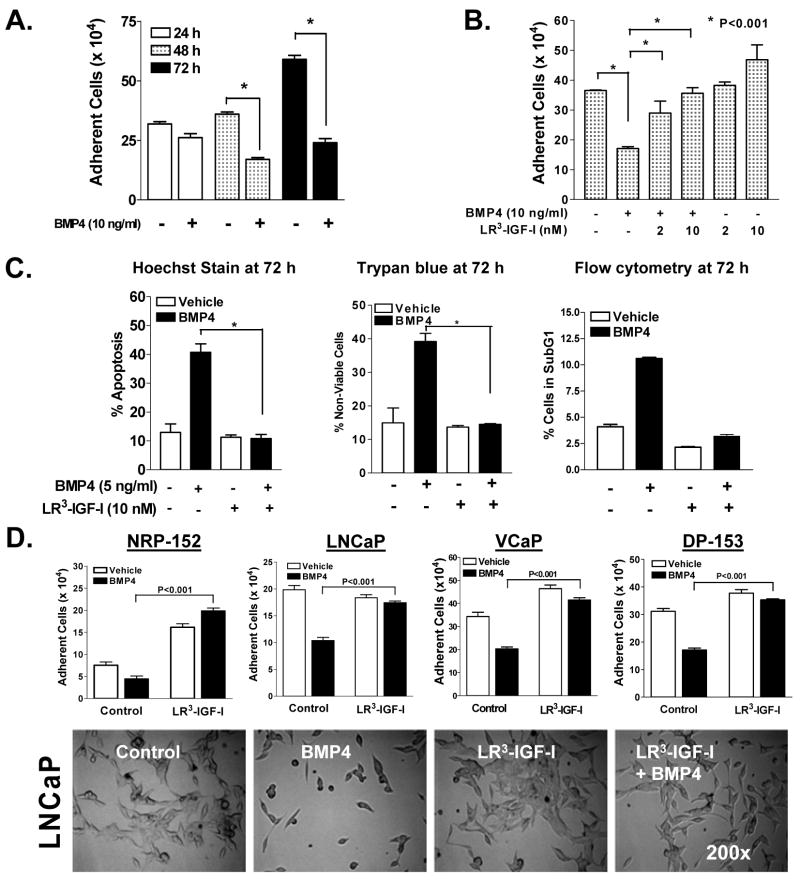
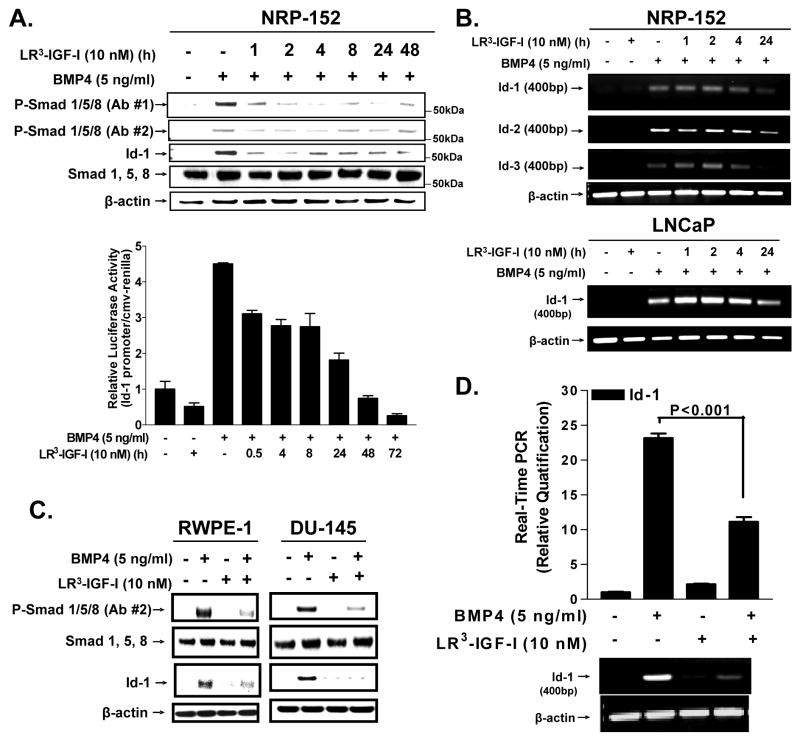
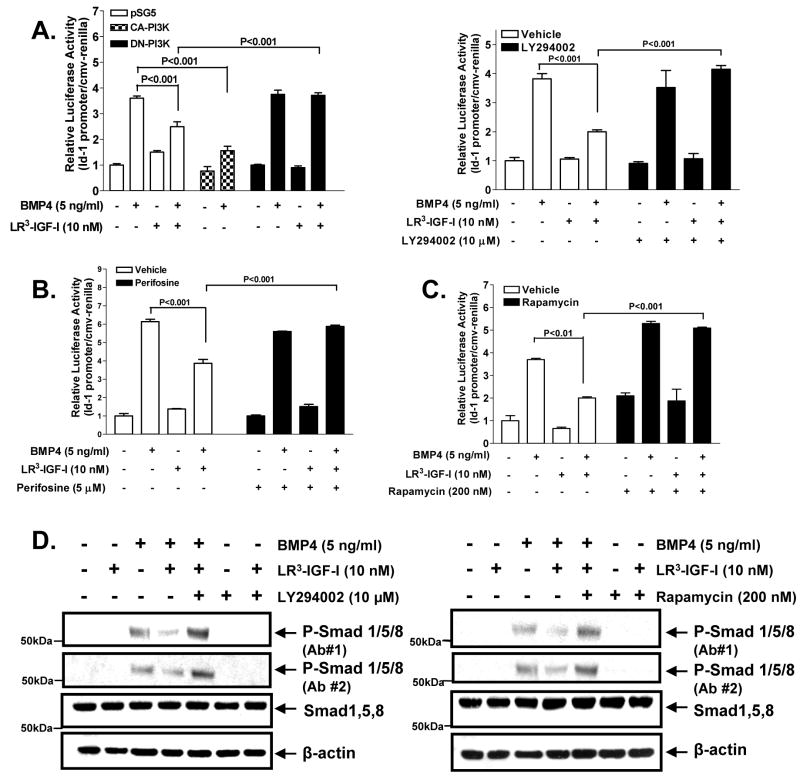
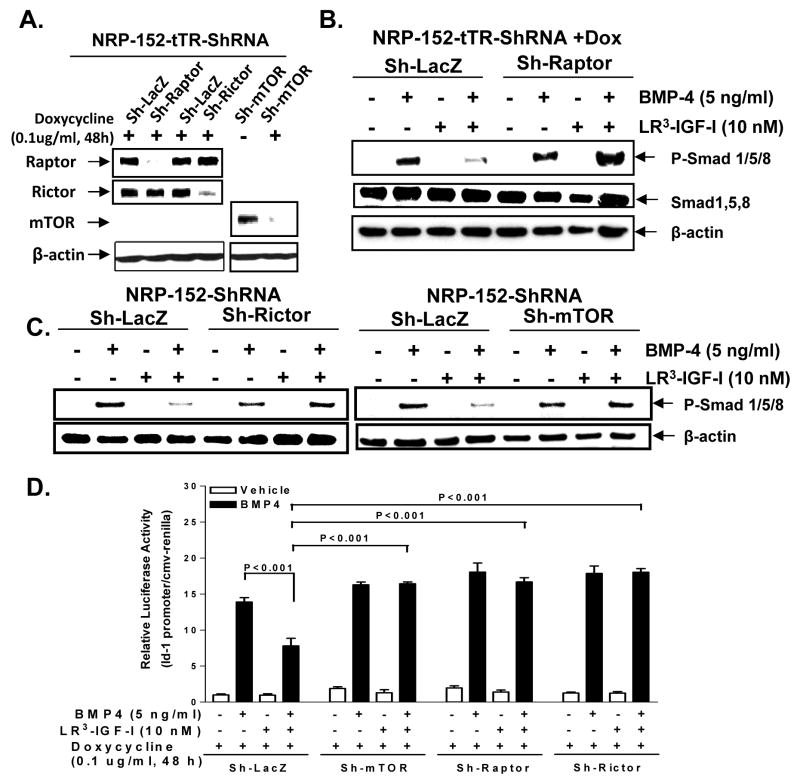
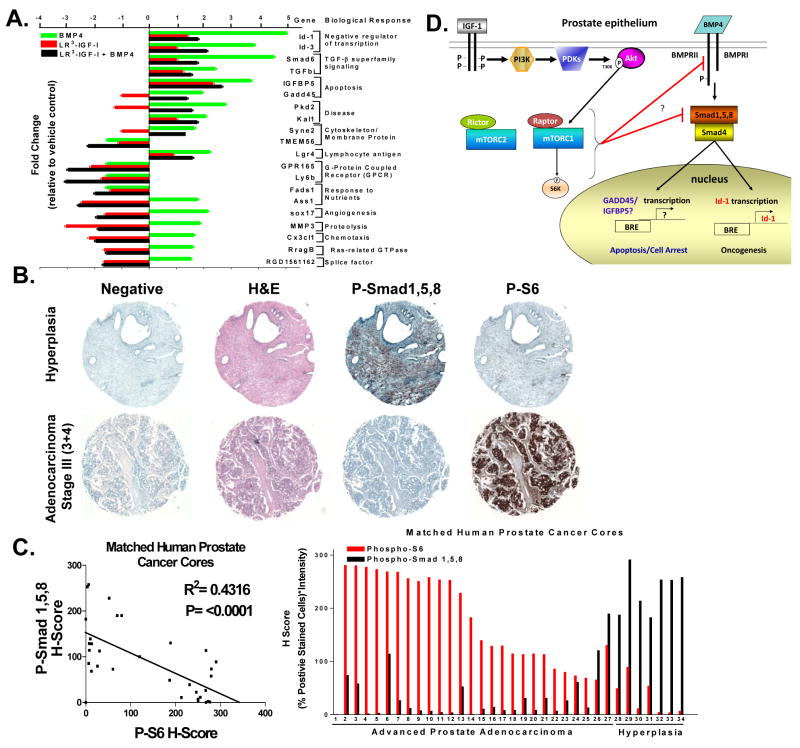
Insulin-like growth factor (IGF) I and bone morphogenetic proteins (BMP) are critical regulators of prostate tumor cell growth. In this report, we offer evidence that a critical support of IGF-I in prostate cancer is mediated by its ability to suppress BMP4-induced apoptosis and Smad-mediated gene expression. Suppression of BMP4 signaling by IGF-I was reversed by chemical inhibitors of phosphoinositide 3-kinase (PI3K), Akt, or mTOR; by enforced expression of wild-type PTEN or dominant-negative PI3K; or by small hairpin RNA-mediated silencing of mTORC1/2 subunits Raptor or Rictor. Similarly, IGF-I suppressed BMP4-induced transcription of the Id1, Id2, and Id3 genes that are crucially involved in prostate tumor progression through PI3K-dependent and mTORC1/2-dependent mechanisms. Immunohistochemical analysis of non-malignant and malignant prostate tissues offered in vivo support for our model that IGF-I-mediated activation of mTOR suppresses phosphorylation of the BMP-activated Smad transcription factors. Our results offer the first evidence that IGF-I signaling through mTORC1/2 is a key homeostatic regulator of BMP4 function in prostate epithelial cells, acting at two levels to repress both the proapoptotic and pro-oncogenic signals of BMP-activated Smads. We suggest that deregulation of this homeostatic control may be pivotal to the development and progression of prostate cancer, providing important implications and new potential targets for the therapeutic intervention of this malignancy.
Copyright © 2010 AACR.
Figures
Similar articles
-
Critical role of a survivin/TGF-β/mTORC1 axis in IGF-I-mediated growth of prostate epithelial cells.PLoS One. 2013 May 1;8(5):e61896. doi: 10.1371/journal.pone.0061896. Print 2013. PLoS One. 2013. PMID: 23658701 Free PMC article.
-
Inhibition of mTORC1 kinase activates Smads 1 and 5 but not Smad8 in human prostate cancer cells, mediating cytostatic response to rapamycin.Mol Cancer Res. 2012 Jun;10(6):821-33. doi: 10.1158/1541-7786.MCR-11-0615. Epub 2012 Mar 27. Mol Cancer Res. 2012. PMID: 22452883 Free PMC article.
-
Insulin-like growth factor-I inhibits transcriptional responses of transforming growth factor-beta by phosphatidylinositol 3-kinase/Akt-dependent suppression of the activation of Smad3 but not Smad2.J Biol Chem. 2003 Oct 3;278(40):38342-51. doi: 10.1074/jbc.M304583200. Epub 2003 Jul 21. J Biol Chem. 2003. PMID: 12876289
-
Bone morphogenetic proteins.Growth Factors. 2004 Dec;22(4):233-41. doi: 10.1080/08977190412331279890. Growth Factors. 2004. PMID: 15621726 Review.
-
Growth factor signaling pathways as targets for prevention of epithelial carcinogenesis.Mol Carcinog. 2011 Apr;50(4):264-79. doi: 10.1002/mc.20665. Epub 2010 Jul 20. Mol Carcinog. 2011. PMID: 20648549 Free PMC article. Review.
Cited by
-
Combined Inhibition of IGF-1R/IR and Src family kinases enhances antitumor effects in prostate cancer by decreasing activated survival pathways.PLoS One. 2012;7(12):e51189. doi: 10.1371/journal.pone.0051189. Epub 2012 Dec 26. PLoS One. 2012. PMID: 23300537 Free PMC article.
-
Critical role of a survivin/TGF-β/mTORC1 axis in IGF-I-mediated growth of prostate epithelial cells.PLoS One. 2013 May 1;8(5):e61896. doi: 10.1371/journal.pone.0061896. Print 2013. PLoS One. 2013. PMID: 23658701 Free PMC article.
-
Survivin and Tumorigenesis: Molecular Mechanisms and Therapeutic Strategies.J Cancer. 2016 Jan 10;7(3):314-23. doi: 10.7150/jca.13332. eCollection 2016. J Cancer. 2016. PMID: 26918045 Free PMC article. Review.
-
Hic-5 controls BMP4 responses in prostate cancer cells through interacting with Smads 1, 5 and 8.Oncogene. 2012 May 10;31(19):2480-90. doi: 10.1038/onc.2011.422. Epub 2011 Sep 26. Oncogene. 2012. PMID: 21996749 Free PMC article.
-
Gene and microRNA expression reveals sensitivity to paclitaxel in laryngeal cancer cell line.Int J Clin Exp Pathol. 2013 Jun 15;6(7):1351-61. Print 2013. Int J Clin Exp Pathol. 2013. PMID: 23826416 Free PMC article.
References
-
- Wozney JM, Rosen V, Celeste AJ, et al. Novel regulators of bone formation: molecular clones and activities. Science. 1988;242:1528–34. - PubMed
-
- Nohno T, Ishikawa T, Saito T, et al. Identification of a human type II receptor for bone morphogenetic protein-4 that forms differential heteromeric complexes with bone morphogenetic protein type I receptors. J Biol Chem. 1995;270:22522–6. - PubMed
-
- Macias-Silva M, Hoodless PA, Tang SJ, Buchwald M, Wrana JL. Specific activation of Smad1 signaling pathways by the BMP7 type I receptor, ALK2. J Biol Chem. 1998;273:25628–36. - PubMed
-
- Massague J. Receptors for the TGF-beta family. Cell. 1992;69:1067–70. - PubMed
Publication types
MeSH terms
Substances
Grants and funding
- R01AG031903/AG/NIA NIH HHS/United States
- 5T32CA059366-15/CA/NCI NIH HHS/United States
- R01 CA102074/CA/NCI NIH HHS/United States
- T32 CA059366/CA/NCI NIH HHS/United States
- 1F31CA142311-01/CA/NCI NIH HHS/United States
- P30 CA-43703/CA/NCI NIH HHS/United States
- R01 CA134878/CA/NCI NIH HHS/United States
- R01 AG031903/AG/NIA NIH HHS/United States
- R01CA102074/CA/NCI NIH HHS/United States
- P30 CA043703/CA/NCI NIH HHS/United States
- R01 CA092102/CA/NCI NIH HHS/United States
- R01CA092102/CA/NCI NIH HHS/United States
- P30 CA43703/CA/NCI NIH HHS/United States
- F31 CA142311/CA/NCI NIH HHS/United States
LinkOut - more resources
Full Text Sources
Research Materials
Miscellaneous
