Quality of traditional surveillance for public reporting of nosocomial bloodstream infection rates
- PMID: 21063013
- PMCID: PMC8385387
- DOI: 10.1001/jama.2010.1637
Quality of traditional surveillance for public reporting of nosocomial bloodstream infection rates
Abstract
Context: Central line-associated bloodstream infection (BSI) rates, determined by infection preventionists using the Centers for Disease Control and Prevention (CDC) surveillance definitions, are increasingly published to compare the quality of patient care delivered by hospitals. However, such comparisons are valid only if surveillance is performed consistently across institutions.
Objective: To assess institutional variation in performance of traditional central line-associated BSI surveillance.
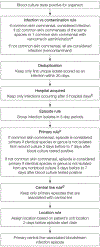
Design, setting, and participants: We performed a retrospective cohort study of 20 intensive care units among 4 medical centers (2004-2007). Unit-specific central line-associated BSI rates were calculated for 12-month periods. Infection preventionists, blinded to study participation, performed routine prospective surveillance using CDC definitions. A computer algorithm reference standard was applied retrospectively using criteria that adapted the same CDC surveillance definitions.
Main outcome measures: Correlation of central line-associated BSI rates as determined by infection preventionist vs the computer algorithm reference standard. Variation in performance was assessed by testing for institution-dependent heterogeneity in a linear regression model.
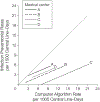
Results: Forty-one unit-periods among 20 intensive care units were analyzed, representing 241,518 patient-days and 165,963 central line-days. The median infection preventionist and computer algorithm central line-associated BSI rates were 3.3 (interquartile range [IQR], 2.0-4.5) and 9.0 (IQR, 6.3-11.3) infections per 1000 central line-days, respectively. Overall correlation between computer algorithm and infection preventionist rates was weak (ρ = 0.34), and when stratified by medical center, point estimates for institution-specific correlations ranged widely: medical center A: 0.83; 95% confidence interval (CI), 0.05 to 0.98; P = .04; medical center B: 0.76; 95% CI, 0.32 to 0.93; P = .003; medical center C: 0.50, 95% CI, -0.11 to 0.83; P = .10; and medical center D: 0.10; 95% CI -0.53 to 0.66; P = .77. Regression modeling demonstrated significant heterogeneity among medical centers in the relationship between computer algorithm and expected infection preventionist rates (P < .001). The medical center that had the lowest rate by traditional surveillance (2.4 infections per 1000 central line-days) had the highest rate by computer algorithm (12.6 infections per 1000 central line-days).
Conclusions: Institutional variability of infection preventionist rates relative to a computer algorithm reference standard suggests that there is significant variation in the application of standard central line-associated BSI surveillance definitions across medical centers. Variation in central line-associated BSI surveillance practice may complicate interinstitutional comparisons of publicly reported central line-associated BSI rates.
Figures


Comment in
-
Surveillance quality in reporting nosocomial bloodstream infection rates.JAMA. 2011 Feb 23;305(8):779-80; author reply 780. doi: 10.1001/jama.2011.157. JAMA. 2011. PMID: 21343574 No abstract available.
References
-
- Fung CH, Lim YW, Mattke S, Damberg C, Shekelle PG. Systematic review: the evidence that publishing patient care performance data improves quality of care. Ann Intern Med. 2008;148(2):111–123. - PubMed
-
- Weinstein RA, Siegel JD, Brennan PJ. Infection-control report cards—securing patient safety. N Engl J Med. 2005;353(3):225–227. - PubMed
-
- Mermel LA. Prevention of intravascular catheter-related infections. Ann Intern Med. 2000;132(5): 391–402. - PubMed
-
- Perencevich EN, Stone PW, Wright SB, Carmeli Y, Fisman DN, Cosgrove SE; Society for Healthcare Epidemiology of America. Raising standards while watching the bottom line: making a business case for infection control. Infect Control Hosp Epidemiol. 2007; 28(10):1121–1133. - PubMed
Publication types
MeSH terms
Grants and funding
LinkOut - more resources
Full Text Sources
Other Literature Sources

