. 2011;3(2):180-99.
doi: 10.1159/000321157. Epub 2010 Nov 9.

Organ-specific innate immune responses in a mouse model of invasive candidiasis

Affiliations

Organ-specific innate immune responses in a mouse model of invasive candidiasis

Michail S Lionakis et al. J Innate Immun. 2011.

Abstract

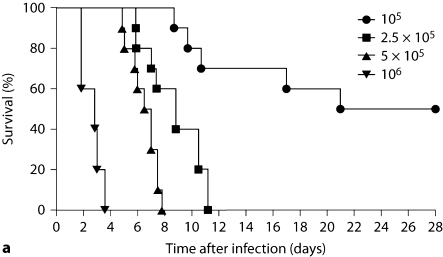
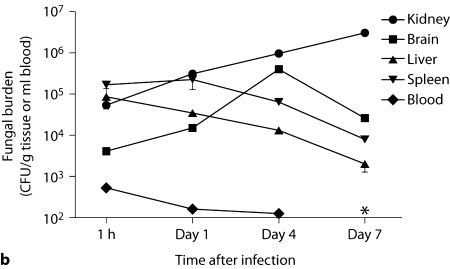
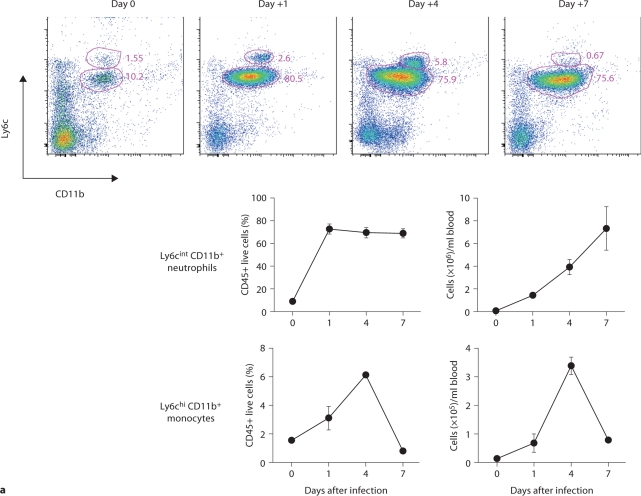
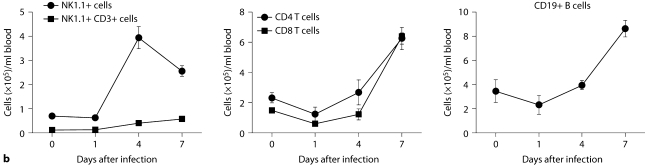
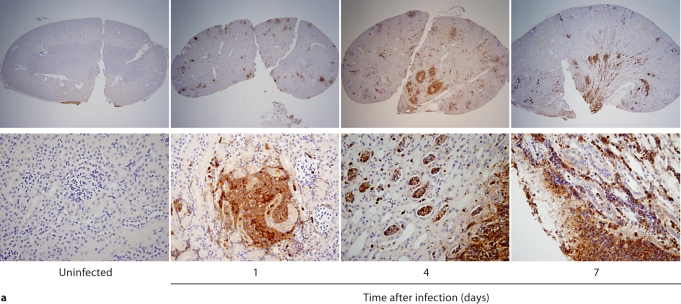
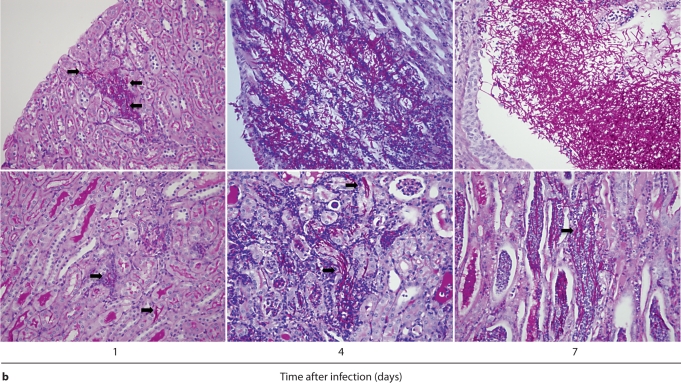
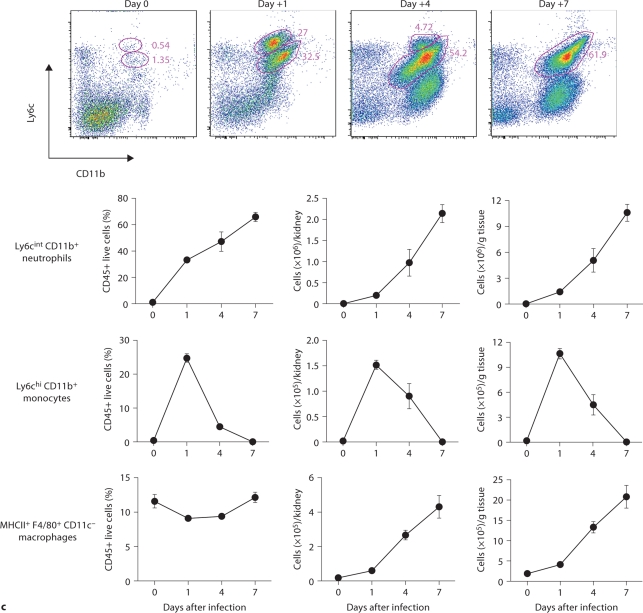
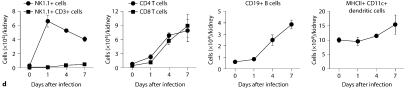
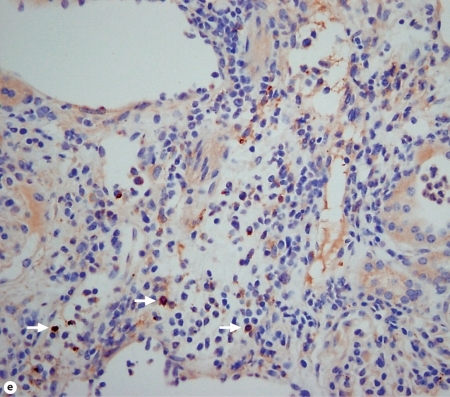
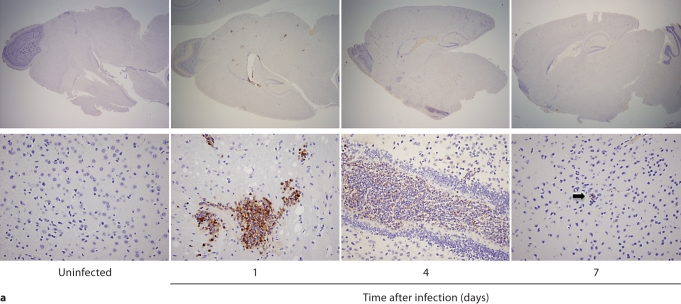
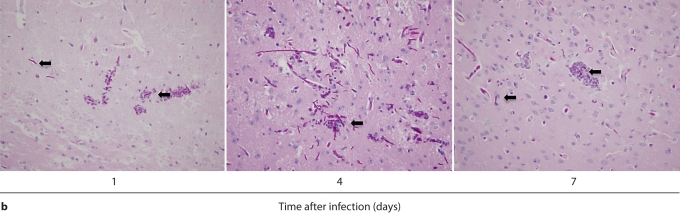
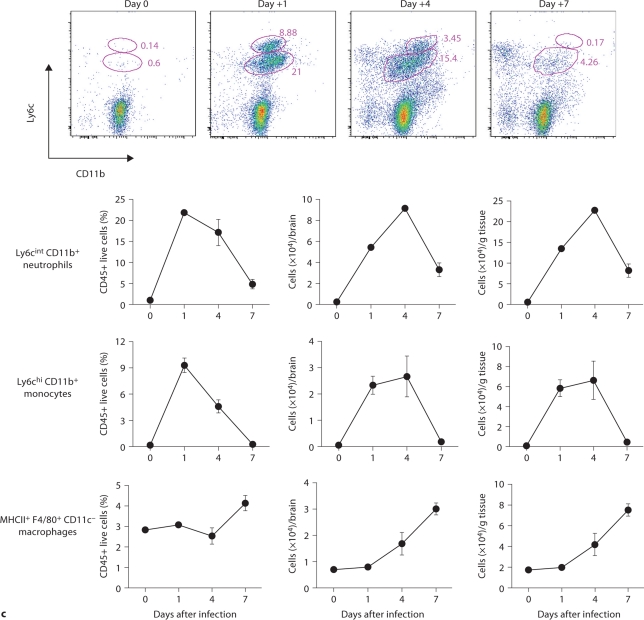
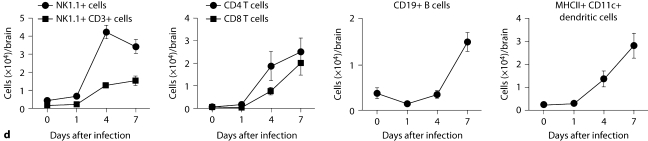
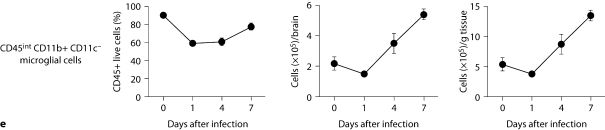
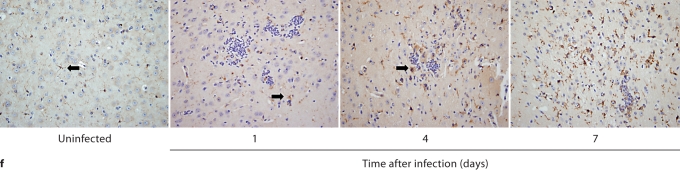
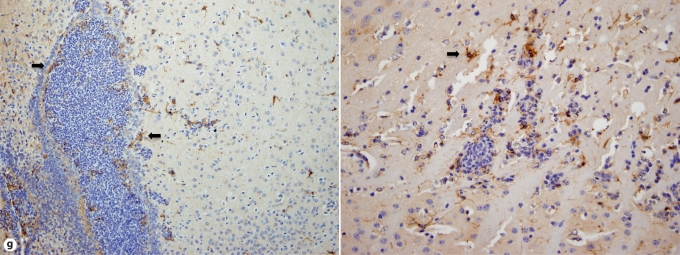
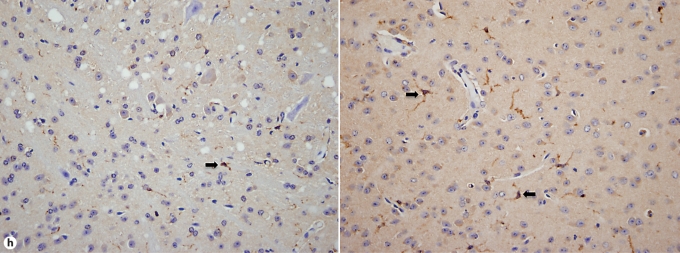
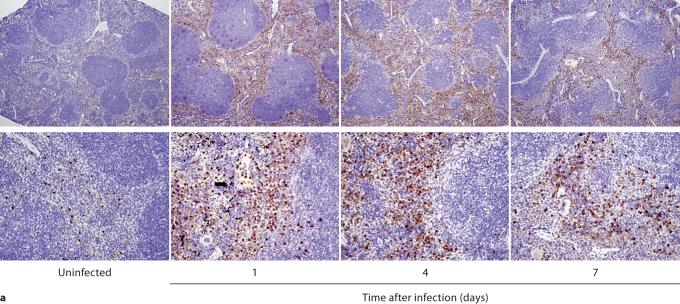
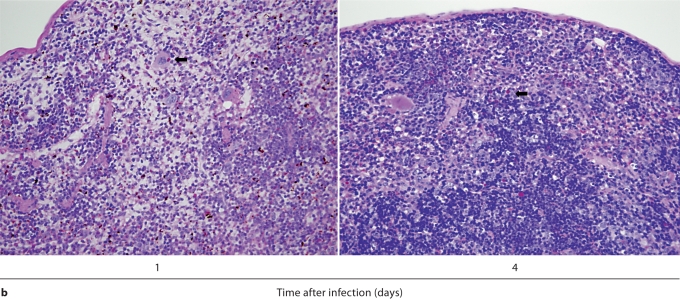
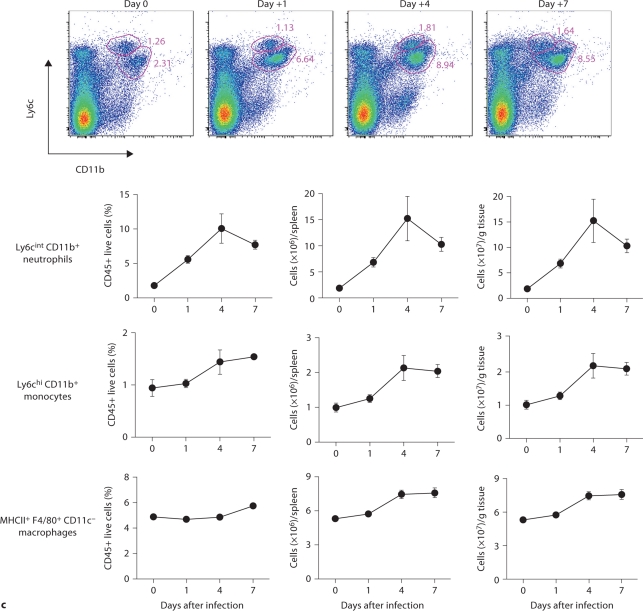
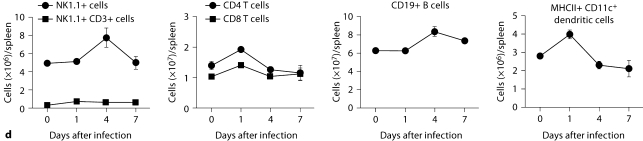
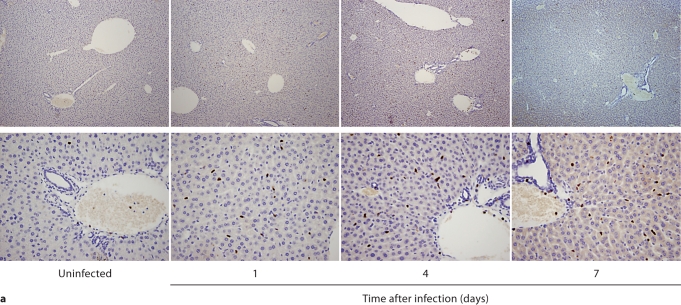
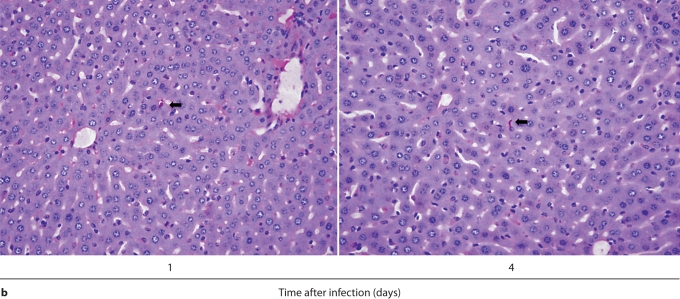
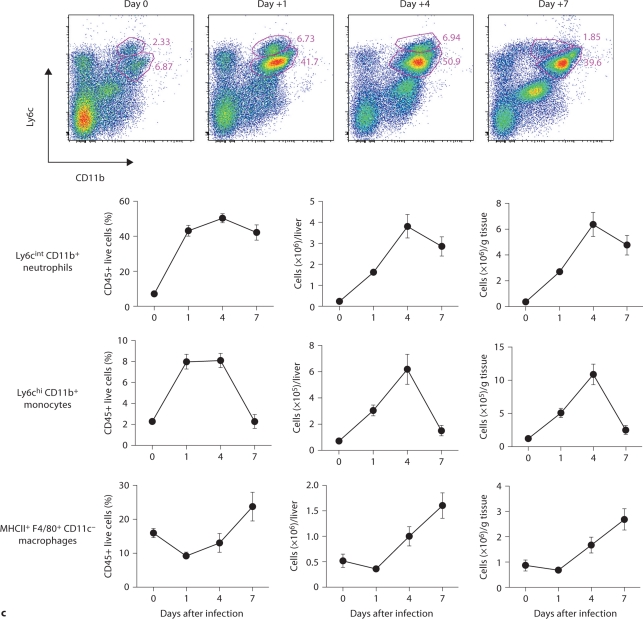
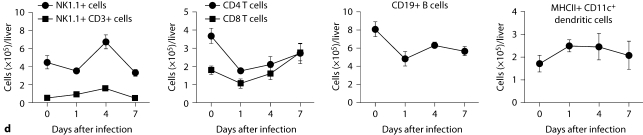
In a fatal mouse model of invasive candidiasis (IC), fungal burden changes with variable dynamics in the kidney, brain, spleen, and liver and declines in all organs except for the kidney, which inexorably loses function. Since leukocytes are required to control Candida, we hypothesized that differential leukocyte infiltration determines organ-specific outcome of the infection. We defined leukocyte accumulation in the blood, kidney, brain, spleen, and liver after infection using fluorescent-activated cell sorting (FACS) and immunohistochemistry. Accumulation of Ly6c(int)CD11b(+) neutrophils predominated in all organs except the brain, where CD45(int)CD11b(+)CD11c(-) microglia were the major leukocytes detected, surrounding foci of invading Candida. Significantly more neutrophils accumulated in the spleen and liver than in the kidney during the first 24 h after infection, when neutrophil presence is critical for Candida control. Conversely, at later time points only the kidney continued to accumulate neutrophils, associated with immunopathology and organ failure. The distribution of neutrophils was completely different in each organ, with large abscesses exclusively forming in the kidney. Candida filamentation, an essential virulence factor, was seen in the kidney but not in the spleen or liver. IC induced Ly6c(hi)CD11b(+) inflammatory monocyte and NK1.1(+) cell expansion in the blood and all organs tested, and MHCII(+)F4/80(+)CD11c(-) macrophage accumulation, mainly in the spleen and liver. This study is the first detailed analysis of leukocyte subsets accumulating in different target organs during IC. The results delineate immune responses to the same pathogen that are highly idiosyncratic for each organ tested. The work provides novel insights into the balance between effective host defense and immunopathology in IC.


Figures

Fig. 1
Fig. 1
Fatal mouse model of systemic IC. Inoculum, 5 × 10 5 CFU. a Mortality of mice intravenously injected with C. albicans is inoculum dependent. The inocula/mouse tested are given in the upper right-hand corner of the figure as CFU. b Microbiological progression of IC is highly variable among tissues. Data are from a single experiment with 4 mice per time point. Graphed are the mean ± SEM data. The asterisk (day 7) denotes that fungal burden in blood was below the limit of detection at this time point.
Fig. 1
Fig. 1
Fatal mouse model of systemic IC. Inoculum, 5 × 10 5 CFU. a Mortality of mice intravenously injected with C. albicans is inoculum dependent. The inocula/mouse tested are given in the upper right-hand corner of the figure as CFU. b Microbiological progression of IC is highly variable among tissues. Data are from a single experiment with 4 mice per time point. Graphed are the mean ± SEM data. The asterisk (day 7) denotes that fungal burden in blood was below the limit of detection at this time point.
Fig. 2
Fig. 2
Dynamics of leukocyte accumulation in blood in a fatal mouse model of systemic IC. Inoculum, 2.5 × 10⁵ CFU. a Representative FACS plots of blood neutrophils and inflammatory monocytes at different time points after infection and in the uninfected state. Graphs show neutrophils and monocytes as percent of CD45+ cells, and as absolute numbers per milliliter of blood. b Accumulation of NK1.1 + cells, T and B lymphocytes in blood after IC. Data are from a single FACS experiment with 3 mice per time point. Graphed are the mean ± SEM data.
Fig. 2
Fig. 2
Dynamics of leukocyte accumulation in blood in a fatal mouse model of systemic IC. Inoculum, 2.5 × 10⁵ CFU. a Representative FACS plots of blood neutrophils and inflammatory monocytes at different time points after infection and in the uninfected state. Graphs show neutrophils and monocytes as percent of CD45+ cells, and as absolute numbers per milliliter of blood. b Accumulation of NK1.1 + cells, T and B lymphocytes in blood after IC. Data are from a single FACS experiment with 3 mice per time point. Graphed are the mean ± SEM data.
Fig. 3
Fig. 3
Kidney-specific cellular immune response in a fatal mouse model of systemic IC. Inoculum, 2.5 × 10⁵ CFU. a Representative 7/4+ IHC images from kidney cross-sections at different time points after infection. Original magnifications: ×20 (top row) and ×400 (bottom row). Brown color represents 7/4+ immune cells. b Representative PAS staining of the kidney at different time points after infection. Original magnification: ×400. Arrows point to representative Candida hyphae. Kidney-specific cellular immune response in a fatal mouse model of systemic IC. Inoculum, 2.5 × 10⁵ CFU. c Representative FACS plots of neutrophils and inflammatory monocytes in the kidney at different time points after infection and in the uninfected state. Graphs show neutrophils, monocytes and macrophages as percent of CD45+ cells, and as absolute numbers per kidney or per gram of tissue. Kidney-specific cellular immune response in a fatal mouse model of systemic IC. Inoculum, 2.5 × 10⁵ CFU. d Accumulation of NK1.1+ cells, T and B lymphocytes, and dendritic cells in kidney after IC. Data are from a single FACS experiment with 3 mice per time point. Graphed are the mean ± SEM data. e Representative NKp46+ IHC image from the kidney on day 4 after infection showing NK cells in the renal interstitium (arrows). Original magnification: <400.
Fig. 3
Fig. 3
Kidney-specific cellular immune response in a fatal mouse model of systemic IC. Inoculum, 2.5 × 10⁵ CFU. a Representative 7/4+ IHC images from kidney cross-sections at different time points after infection. Original magnifications: ×20 (top row) and ×400 (bottom row). Brown color represents 7/4+ immune cells. b Representative PAS staining of the kidney at different time points after infection. Original magnification: ×400. Arrows point to representative Candida hyphae. Kidney-specific cellular immune response in a fatal mouse model of systemic IC. Inoculum, 2.5 × 10⁵ CFU. c Representative FACS plots of neutrophils and inflammatory monocytes in the kidney at different time points after infection and in the uninfected state. Graphs show neutrophils, monocytes and macrophages as percent of CD45+ cells, and as absolute numbers per kidney or per gram of tissue. Kidney-specific cellular immune response in a fatal mouse model of systemic IC. Inoculum, 2.5 × 10⁵ CFU. d Accumulation of NK1.1+ cells, T and B lymphocytes, and dendritic cells in kidney after IC. Data are from a single FACS experiment with 3 mice per time point. Graphed are the mean ± SEM data. e Representative NKp46+ IHC image from the kidney on day 4 after infection showing NK cells in the renal interstitium (arrows). Original magnification: <400.
Fig. 4
Fig. 4
Brain-specific cellular immune response in a fatal mouse model of systemic IC. Inoculum, 2.5 × 10 5 CFU. a Representative 7/4+ IHC images from brain sagittal sections at different time points after infection. Original magnifications: ×20 (top row) and ×400 (bottom row). Brown color represents 7/4+ immune cells. b Representative PAS staining of the brain at different time points after infection. Original magnification: ×400. Arrows point to representative Candida hyphae. c Representative FACS plots of neutrophils and inflammatory monocytes in the brain at different time points after infection and in the uninfected state. Graphs show neutrophils, monocytes and macrophages as percentages of CD45+ cells, and as absolute numbers per brain or per gram of tissue. d Accumulation of NK1.1+ cells, T and B lymphocytes, and dendritic cells in brain after IC. Brain-specific cellular immune response in a fatal mouse model of systemic IC. Inoculum, 2.5 × 10 5 CFU. e Accumulation of microglia in the brain after Candida challenge. Graphs show microglial cells as percent of CD45+ cells, and as absolute numbers per brain or per gram of tissue. Data are from a single FACS experiment with 3 mice per time point. Graphed are the mean ± SEM data. f Representative Iba1+ IHC images from the brain at different time points after infection. Original magnification: ×400. Brown color represents Iba+ microglia. Arrows point to representative Iba+ microglia. Brain-specific cellular immune response in a fatal mouse model of systemic IC. Inoculum, 2.5 × 10⁵ CFU. g Iba1+ IHC brain images on day 4 after infection showing accumulation of microglia (arrows) around neutrophilic abscesses. Original magnification. ×400. h Iba1+ IHC brain images on day 4 after infection showing no expansion of microglia in brain areas where neutrophils are not present. Arrows point to representative Iba+ microglia. Original magnification: ×400.
Fig. 4
Fig. 4
Brain-specific cellular immune response in a fatal mouse model of systemic IC. Inoculum, 2.5 × 10 5 CFU. a Representative 7/4+ IHC images from brain sagittal sections at different time points after infection. Original magnifications: ×20 (top row) and ×400 (bottom row). Brown color represents 7/4+ immune cells. b Representative PAS staining of the brain at different time points after infection. Original magnification: ×400. Arrows point to representative Candida hyphae. c Representative FACS plots of neutrophils and inflammatory monocytes in the brain at different time points after infection and in the uninfected state. Graphs show neutrophils, monocytes and macrophages as percentages of CD45+ cells, and as absolute numbers per brain or per gram of tissue. d Accumulation of NK1.1+ cells, T and B lymphocytes, and dendritic cells in brain after IC. Brain-specific cellular immune response in a fatal mouse model of systemic IC. Inoculum, 2.5 × 10 5 CFU. e Accumulation of microglia in the brain after Candida challenge. Graphs show microglial cells as percent of CD45+ cells, and as absolute numbers per brain or per gram of tissue. Data are from a single FACS experiment with 3 mice per time point. Graphed are the mean ± SEM data. f Representative Iba1+ IHC images from the brain at different time points after infection. Original magnification: ×400. Brown color represents Iba+ microglia. Arrows point to representative Iba+ microglia. Brain-specific cellular immune response in a fatal mouse model of systemic IC. Inoculum, 2.5 × 10⁵ CFU. g Iba1+ IHC brain images on day 4 after infection showing accumulation of microglia (arrows) around neutrophilic abscesses. Original magnification. ×400. h Iba1+ IHC brain images on day 4 after infection showing no expansion of microglia in brain areas where neutrophils are not present. Arrows point to representative Iba+ microglia. Original magnification: ×400.
Fig. 5
Fig. 5
Spleen-specific cellular immune response in a fatal mouse model of systemic IC. Inoculum, 2.5 × 10⁵ CFU. a Representative 7/4+ IHC images from spleen cross-sections at different time points after infection. Original magnifications: × 20 (top row) and ×400 (bottom row). Brown color represents 7/4+ immune cells and the arrow points to hemosiderin deposition. b Representative PAS staining of the spleen at different time points after infection. Original magnification: ×400. Arrows point to Candida yeasts. c Representative FACS plots of neutrophils and inflammatory monocytes in the spleen at different time points after infection and in the uninfected state. Graphs show neutrophils, monocytes and macrophages as percent of CD45+ cells, and as absolute numbers per spleen or per gram of tissue. d Accumulation of NK1.1+ cells, T and B lymphocytes, and dendritic cells in the spleen after Candida challenge. Data are from a single FACS experiment with 3 mice per time point. Graphed are the mean ± SEM data.
Fig. 5
Fig. 5
Spleen-specific cellular immune response in a fatal mouse model of systemic IC. Inoculum, 2.5 × 10⁵ CFU. a Representative 7/4+ IHC images from spleen cross-sections at different time points after infection. Original magnifications: × 20 (top row) and ×400 (bottom row). Brown color represents 7/4+ immune cells and the arrow points to hemosiderin deposition. b Representative PAS staining of the spleen at different time points after infection. Original magnification: ×400. Arrows point to Candida yeasts. c Representative FACS plots of neutrophils and inflammatory monocytes in the spleen at different time points after infection and in the uninfected state. Graphs show neutrophils, monocytes and macrophages as percent of CD45+ cells, and as absolute numbers per spleen or per gram of tissue. d Accumulation of NK1.1+ cells, T and B lymphocytes, and dendritic cells in the spleen after Candida challenge. Data are from a single FACS experiment with 3 mice per time point. Graphed are the mean ± SEM data.
Fig. 6
Fig. 6
Liver-specific cellular immune response in a fatal mouse model of systemic IC. Inoculum, 2.5 × 10⁵ CFU. a Representative 7/4+ IHC images from liver cross-sections at different time points after infection. Original magnifications: ×20 (top row) and ×400 (bottom row). Brown color represents 7/4+ immune cells. b Representative PAS staining of the liver at different time points after infection. Original magnification: ×400. Arrows point to Candida yeast and germ tube forms. c Representative FACS plots of neutrophils and inflammatory monocytes in the liver at different time points after infection and in the uninfected state. Graphs show neutrophils, monocytes and macrophages as percent of CD45+ cells, and as absolute numbers per liver or per gram of tissue. d Accumulation of NK1.1+ cells, T and B lymphocytes, and dendritic cells in the liver after Candida challenge. Data are from a single FACS experiment with 3 mice per time point. Graphed are the mean ± SEM data.
Fig. 6
Fig. 6
Liver-specific cellular immune response in a fatal mouse model of systemic IC. Inoculum, 2.5 × 10⁵ CFU. a Representative 7/4+ IHC images from liver cross-sections at different time points after infection. Original magnifications: ×20 (top row) and ×400 (bottom row). Brown color represents 7/4+ immune cells. b Representative PAS staining of the liver at different time points after infection. Original magnification: ×400. Arrows point to Candida yeast and germ tube forms. c Representative FACS plots of neutrophils and inflammatory monocytes in the liver at different time points after infection and in the uninfected state. Graphs show neutrophils, monocytes and macrophages as percent of CD45+ cells, and as absolute numbers per liver or per gram of tissue. d Accumulation of NK1.1+ cells, T and B lymphocytes, and dendritic cells in the liver after Candida challenge. Data are from a single FACS experiment with 3 mice per time point. Graphed are the mean ± SEM data.

References

    1. Zaoutis TE, Argon J, Chu J, Berlin JA, Walsh TJ, Feudtner C. The epidemiology and attributable outcomes of candidemia in adults and children hospitalized in the United States: a propensity analysis. Clin Infect Dis. 2005;41:1232–1239. - PubMed
    1. Papadimitriou JM, Ashman RB. The pathogenesis of acute systemic candidiasis in a susceptible inbred mouse strain. J Pathol. 1986;150:257–265. - PubMed
    1. Spellberg B, Ibrahim AS, Edwards JE, Jr, Filler SG. Mice with disseminated candidiasis die of progressive sepsis. J Infect Dis. 2005;192:336–343. - PubMed
    1. MacCallum DM, Odds FC. Need for early antifungal treatment confirmed in experimental disseminated Candida albicans infection. Antimicrob Agents Chemother. 2004;48:4911–4914. - PMC - PubMed
    1. Fulurija A, Ashman RB, Papadimitriou JM. Neutrophil depletion increases susceptibility to systemic and vaginal candidiasis in mice, and reveals differences between brain and kidney in mechanisms of host resistance. Microbiology. 1996;142:3487–3496. - PubMed

Publication types

MeSH terms