. 2010;26(4-5):707-16.
doi: 10.1159/000322338. Epub 2010 Oct 29.

Modulation of ghrelin O-acyltransferase expression in pancreatic islets

Affiliations

Modulation of ghrelin O-acyltransferase expression in pancreatic islets

Wenjiao An et al. Cell Physiol Biochem. 2010.

Abstract

Background: Ghrelin, the only identified circulating orexigenic signal, is unique in structure in which a specific acyl-modification of its third serine occurs. This acylation is necessary for ghrelin to bind to its receptor and to exert its biologic activity, which is catalyzed by ghrelin O-acyltransferase (GOAT). Although ghrelin is mainly secreted from gastric X/A like endocrine cells, it is also expressed in pancreatic islet cells and regulates insulin secretion. In this study, we examined the expression and regulation of GOAT in pancreas.

Methods: GOAT mRNA and immunoreactivity were examined in pancreatic islets and INS-1 cells by RT-PCR and immunofluorescent staining or Western blotting.

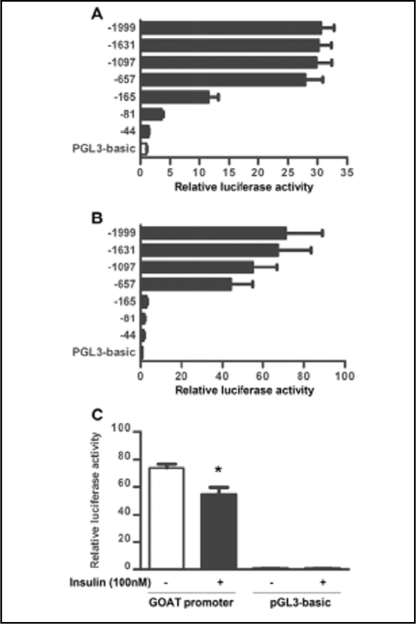
Results: Insulin inhibits the expression of GOAT mRNA and GOAT promoter activity in a dose and time-dependent manner. The mammalian target of rapamycin (mTOR) is activated by insulin. Blocking mTOR signaling by either rapamycin or overexpression of its negative regulator tuberous sclerosis complex 1 (TSC1) or TSC2 attenuates the inhibitory effect of insulin on the transcription and translation of GOAT.

Conclusion: Our study suggests that GOAT is present in pancreatic islet cells and that insulin inhibits the expression of GOAT via the mediation of mTOR signaling.


Figures

Fig. 1
Fig. 1
Expression of GOAT in pancreas and INS-1 cells. (A) Detection of GOAT expression in rat pancreas. Expression of GOAT in the gastric epithelium was used as positive control. (B) Localization of GOAT in rat and mouse pancreas. Images depicting GOAT (green), insulin (red) and nuclei (blue) in pancreatic islet. Merged image illustrates colocalization of GOAT and insulin. (C) Expression of GOAT and ghrelin mRNA in rat tissues and INS-1cells was detected by PCR. β-actin was used as internal control. (D) Expression of GOAT protein in rat tissues and INS-1cells was detected by Western blot. β-actin was used as internal control.
Fig. 2
Fig. 2
Modulation of GOAT expression by insulin in INS-1 cells. (A&B) Time course effect of 100 nM insulin treatment for the indicated time periods on GOAT mRNA (A) and protein (B) levels in INS-1 cells. (C&D) Dose-dependent effect of insulin treatment with indicated concentrations for 16 h on GOAT mRNA (C) and protein (D) levels in INS-1 cells. (E) Attenuation of insulin-induced inhibition of GOAT expression by wortmannin treatment (1μM). Representative Western blots of p-Akt and p-S6 were shown in panel E. β-actin was used as internal control. Relative GOAT mRNA levels were normalized with respect to the levels of untreated cells. Data are means±SEM from 4 separate experiments. *P<0.05, **P<0.01 versus untreated cells. ##P<0.01 versus insulin-treated alone.
Fig. 3
Fig. 3
Modulation of GOAT transcription by insulin in INS-1 cells. Relative luciferase activity in HEK 293 cells (A) and INS- 1 cells (B) in transient transfection assays using the series of plasmid constructs. (C) Inhibition of GOAT promoter activity (-1999 bp upstream of the transcriptional initiation site) by insulin (100 nM) in INS-1 cells. The basal promoter activity of each test plasmid is indicated as luciferase activity normalized by each internal control activity (pSV-β-galactosidase). Relative luciferase activity was normalized with respect to the activity of PGL3-basic in untreated cells. Data are mean±SEM of 3 independent duplicated experiments. *P<0.05 versus insulin untreated cells transfected with GOAT promoter.
Fig. 4
Fig. 4
Activation of mTOR signaling by insulin in INS-1 cells. Cells were incubated with 100 nM insulin for the indicated time and whole-cell lysates were used for Western blotting. Total and phosphorylation form of Akt (Ser473), TSC2 (Thr1462), mTOR (Ser2448) and S6 ribosomal protein, the downstream target of mTOR were detected. The eIF4E was used as internal control.
Fig. 5
Fig. 5
Modulation of GOAT expression by mTOR signaling inhibition. (A) Time course effect of 25 nM rapamycin, the mTOR signaling inhibitor, on GOAT mRNA and protein levels in INS-1 cells. (B) Dose-response of rapamycin treatment with indicated concentrations for 16 hours on GOAT mRNA and protein levels in INS-1 cells. *P<0.05, **P<0.01 versus untreated cells. (C) Results of quantitative PCR analysis of pancreatic GOAT mRNA levels in mice that received intraperitoneal injection of DMSO, rapamycin (1 mg/kg body weight/day for 7 days) or L-leucine (0.45g/kg body weight/day for 7 days), an activator of mTOR. β- actin was used as internal control. Relative GOAT mRNA levels were normalized with respect to the levels of DMSO-treated mice. *P<0.05, **P<0.01 versus DMSO-treated mice. (D) Upregulation of GOAT mRNA and protein levels by overexpression of TSC1 and TSC2 in INS-1 cells. INS-1 cells were transfected with one of the following plasmids: pcDNA3.1, human TSC1, rat TSC2. **P<0.01 versus cells transfected with pcDNA3 alone. (E) Activation of GOAT promoter activity by rapamycin in INS-1 cells. Data are mean±SEM of 3 independent duplicated experiments. **P<0.01 versus rapamycin untreated cells transfected with GOAT promoter. (F) Activation of GOAT promoter activity by overexpression of TSC1 and TSC2 in INS-1 cells. INS-1 cells were co-transfected with GOAT promoter-luciferase plasmid and one of the following plasmids: pcDNA3.1, human TSC1, rat TSC2. **P<0.01 versus cells co-transfected with pcDNA3 and GOAT promoter. The basal promoter activity of each test plasmid is indicated as luciferase activity normalized by each internal control activity (pSV-β-galactosidase). Relative luciferase activity was normalized with respect to the activity of PGL3-basic in untreated cells. The lower panels of western blot confirmed the inhibition of mTOR activity by rapamycin or TSC1 and TSC2 transfection.
Fig. 6
Fig. 6
Role of mTOR signaling in inhibition of GOAT expression by insulin in INS-1 cells. (A) Attenuation of insulin-induced inhibition of GOAT expression by rapamycin treatment (25nM). β-actin was used as internal control. Relative GOAT mRNA levels were normalized with respect to levels of untreated cells. (B) Attenuation of insulin-induced inhibition of GOAT promoter activity by rapamycin treatment. The basal promoter activity is indicated as luciferase activity normalized by internal control activity (pSV-β-galactosidase). Relative luciferase activity was normalized with respect to the activity of PGL3-basic in untreated cells. (C) Attenuation of insulin-induced inhibition of GOAT expression by overexpression of TSC1 and TSC2 in INS-1 cells. β-actin was used as internal control. Relative GOAT mRNA levels were normalized with respect to levels of cells transfected with pcDNA3.1 alone. Data are mean±SEM of 3 independent duplicated experiments. *P<0.05, **P<0.01 versus untreated cells. ##P<0.01 versus insulin-treated alone. Representative Western blots of p-Akt, p-mTOR and p-S6 were shown. eIF4E was used as the internal control.

Similar articles

Cited by

References

    1. Kojima M, Hosoda H, Date Y, Nakazato M, Matsuo H, Kangawa K. Ghrelin is a growth-hormone-releasing acylated peptide from stomach. Nature. 1999;402:656–660. - PubMed
    1. Kojima M, Kangawa K. Ghrelin: Structure and function. Physiol Rev. 2005;85:495–522. - PubMed
    1. Zhang W, Chen M, Chen X, Segura BJ, Mulholland MW. Inhibition of pancreatic protein secretion by ghrelin in the rat. J Physiol. 2001;537:231–236. - PMC - PubMed
    1. Zhang W, Hu Y, Lin TR, Fan Y, Mulholland MW. Stimulation of neurogenesis in rat nucleus of the solitary tract by ghrelin. Peptides. 2005;26:2280–2288. - PubMed
    1. Zhang W, Lin TR, Hu Y, Fan Y, Zhao L, Stuenkel EL, Mulholland MW. Ghrelin stimulates neurogenesis in the dorsal motor nucleus of the vagus. J Physiol. 2004;559:729–737. - PMC - PubMed

Publication types