

Dietary intervention in infancy and later signs of beta-cell autoimmunity
- PMID: 21067382
- PMCID: PMC4242902
- DOI: 10.1056/NEJMoa1004809
Dietary intervention in infancy and later signs of beta-cell autoimmunity
Abstract
Background: Early exposure to complex dietary proteins may increase the risk of beta-cell autoimmunity and type 1 diabetes in children with genetic susceptibility. We tested the hypothesis that supplementing breast milk with highly hydrolyzed milk formula would decrease the cumulative incidence of diabetes-associated autoantibodies in such children.
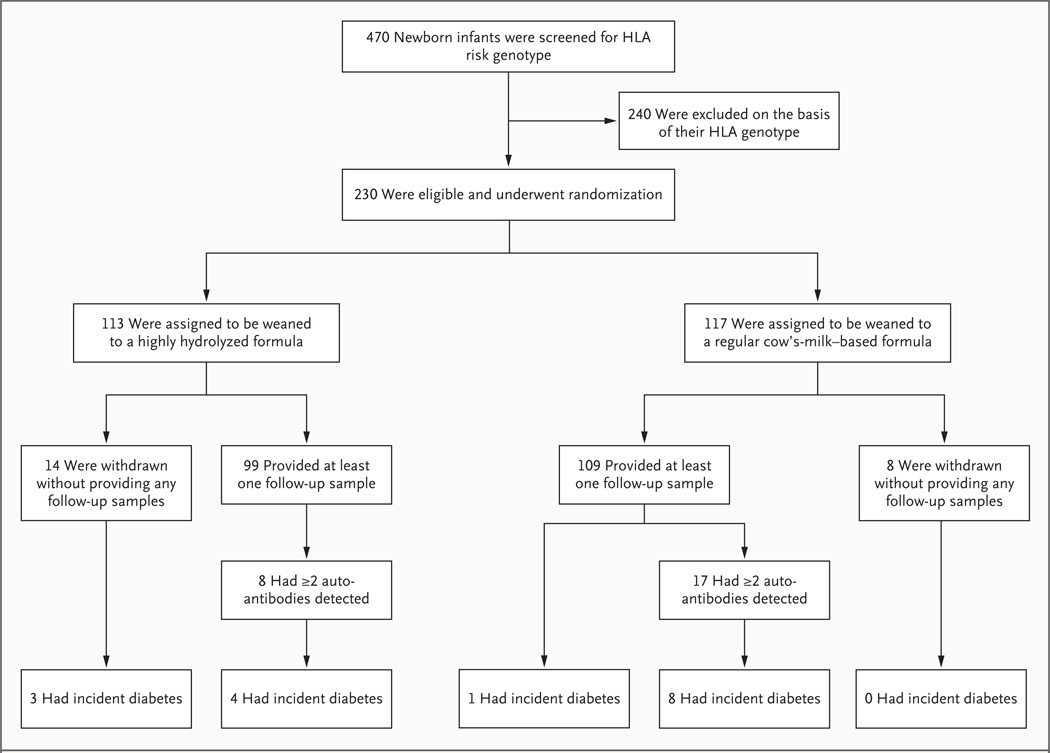
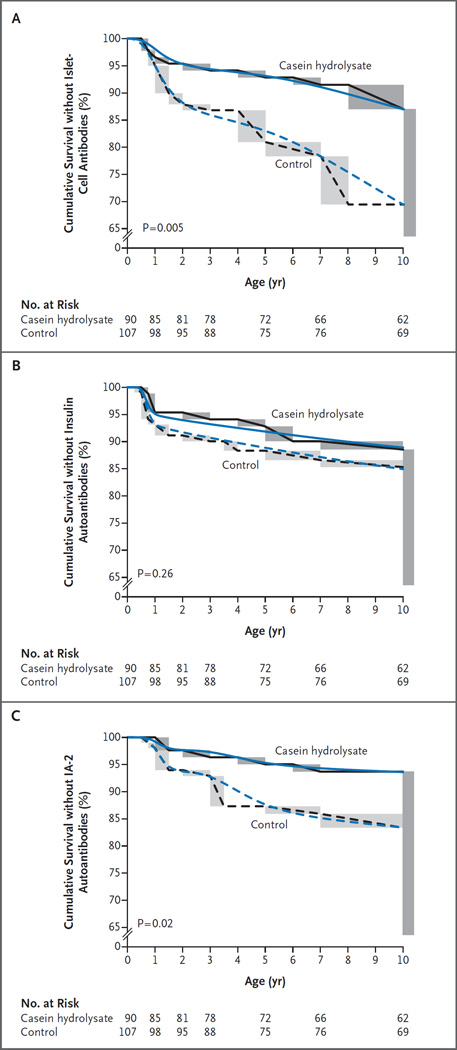
Methods: In this double-blind, randomized trial, we assigned 230 infants with HLA-conferred susceptibility to type 1 diabetes and at least one family member with type 1 diabetes to receive either a casein hydrolysate formula or a conventional, cow's-milk-based formula (control) whenever breast milk was not available during the first 6 to 8 months of life. Autoantibodies to insulin, glutamic acid decarboxylase (GAD), the insulinoma-associated 2 molecule (IA-2), and zinc transporter 8 were analyzed with the use of radiobinding assays, and islet-cell antibodies were analyzed with the use of immunofluorescence, during a median observation period of 10 years (mean, 7.5). The children were monitored for incident type 1 diabetes until they were 10 years of age.
Results: The unadjusted hazard ratio for positivity for one or more autoantibodies in the casein hydrolysate group, as compared with the control group, was 0.54 (95% confidence interval [CI], 0.29 to 0.95), and the hazard ratio adjusted for an observed difference in the duration of exposure to the study formula was 0.51 (95% CI, 0.28 to 0.91). The unadjusted hazard ratio for positivity for two or more autoantibodies was 0.52 (95% CI, 0.21 to 1.17), and the adjusted hazard ratio was 0.47 (95% CI, 0.19 to 1.07). The rate of reported adverse events was similar in the two groups.
Conclusions: Dietary intervention during infancy appears to have a long-lasting effect on markers of beta-cell autoimmunity--markers that may reflect an autoimmune process leading to type 1 diabetes. (ClinicalTrials.gov number, NCT00570102.).
Figures

Comment in
-
Infant formula, autoimmune triggers, and type 1 diabetes.N Engl J Med. 2010 Nov 11;363(20):1961-3. doi: 10.1056/NEJMe1010654. N Engl J Med. 2010. PMID: 21067389 No abstract available.
-
Diet in infancy and later signs of beta-cell autoimmunity.N Engl J Med. 2011 Mar 3;364(9):879-80; author reply 880. doi: 10.1056/NEJMc1100063. N Engl J Med. 2011. PMID: 21366481 No abstract available.
-
Diet in infancy and later signs of beta-cell autoimmunity.N Engl J Med. 2011 Mar 3;364(9):879; author reply 880. doi: 10.1056/NEJMc1100063. N Engl J Med. 2011. PMID: 21366482 No abstract available.
References
-
- Knip M. Natural course of preclinical type 1 diabetes. Horm Res. 2002;57(Suppl 1):6–11. - PubMed
-
- Idem. Can we predict type 1 diabetes in the general population? Diabetes Care. 2002;25:623–5. - PubMed
-
- Knip M. Should we screen for risk of type 1 diabetes? Diabetes Care. 2008;31:622–623. - PubMed
-
- Ziegler A-G, Hummel M, Schenker M, Bonifacio E. Autoantibody appearance and risk for development of childhood diabetes in offspring of parents with type 1 diabetes: the 2-year analysis of the German BABYDIAB Study. Diabetes. 1999;48:460–468. - PubMed
Publication types
MeSH terms
Substances
Associated data
Grants and funding
LinkOut - more resources
Full Text Sources
Other Literature Sources
Medical
Research Materials