

Concept and application of a computational vaccinology workflow
- PMID: 21067549
- PMCID: PMC2981879
- DOI: 10.1186/1745-7580-6-S2-S7
Concept and application of a computational vaccinology workflow
Abstract
Background: The last years have seen a renaissance of the vaccine area, driven by clinical needs in infectious diseases but also chronic diseases such as cancer and autoimmune disorders. Equally important are technological improvements involving nano-scale delivery platforms as well as third generation adjuvants. In parallel immunoinformatics routines have reached essential maturity for supporting central aspects in vaccinology going beyond prediction of antigenic determinants. On this basis computational vaccinology has emerged as a discipline aimed at ab-initio rational vaccine design.Here we present a computational workflow for implementing computational vaccinology covering aspects from vaccine target identification to functional characterization and epitope selection supported by a Systems Biology assessment of central aspects in host-pathogen interaction. We exemplify the procedures for Epstein Barr Virus (EBV), a clinically relevant pathogen causing chronic infection and suspected of triggering malignancies and autoimmune disorders.
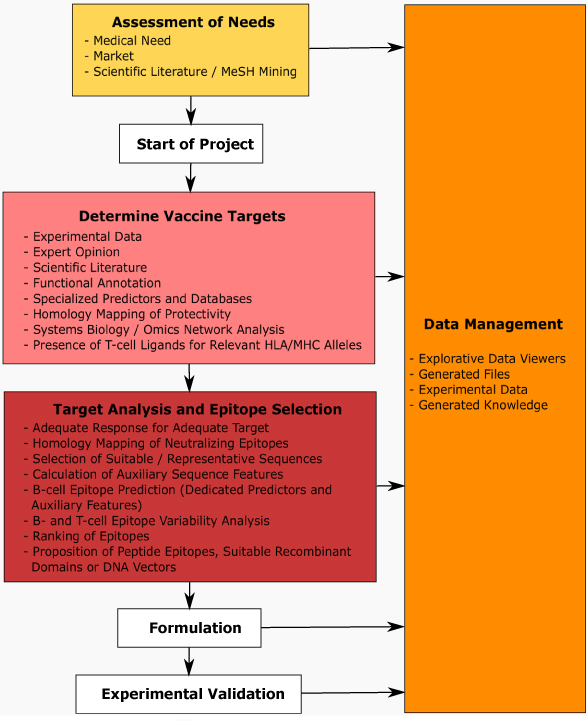
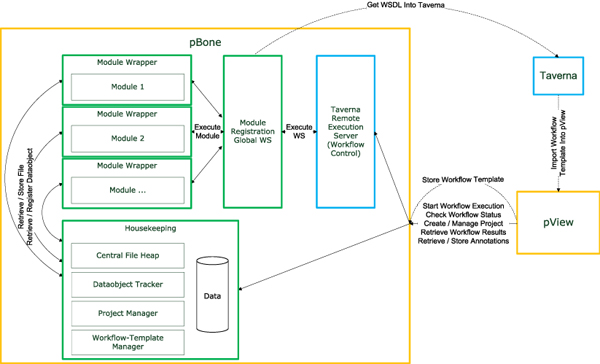
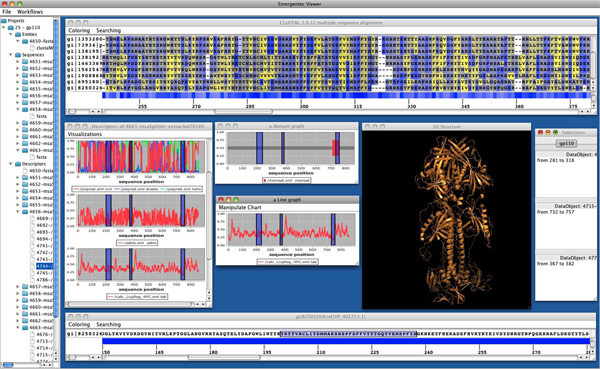
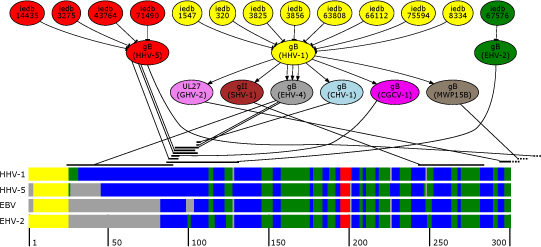
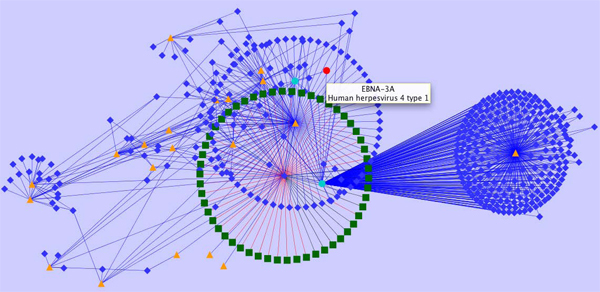
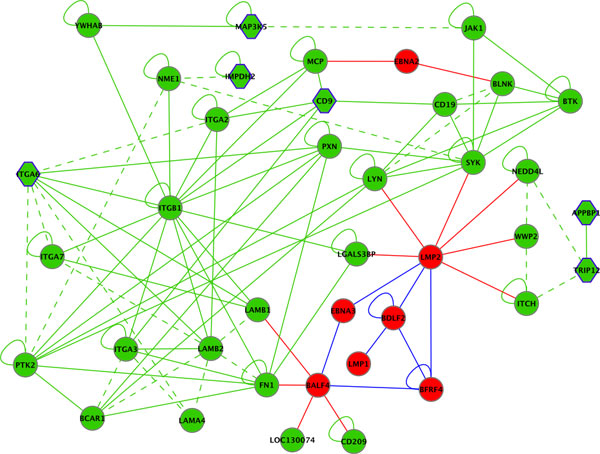
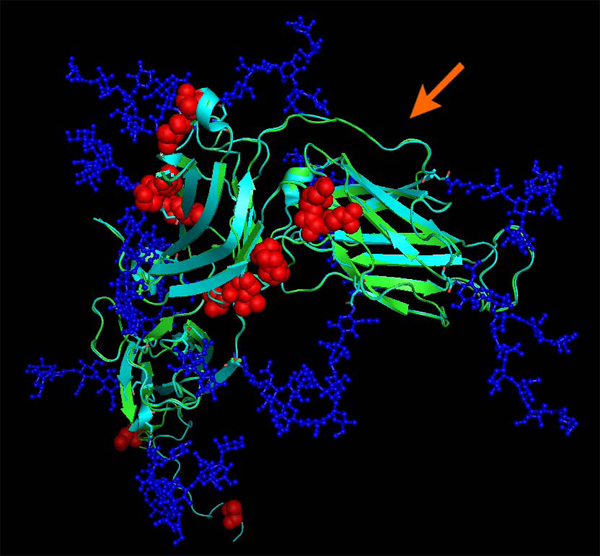
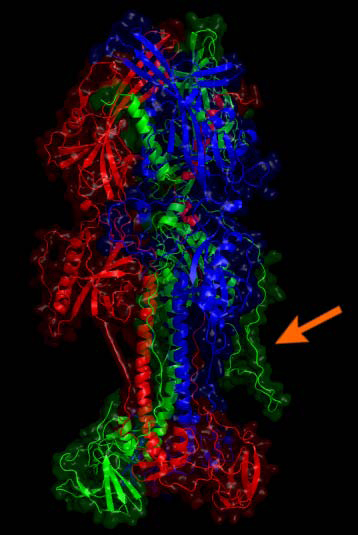
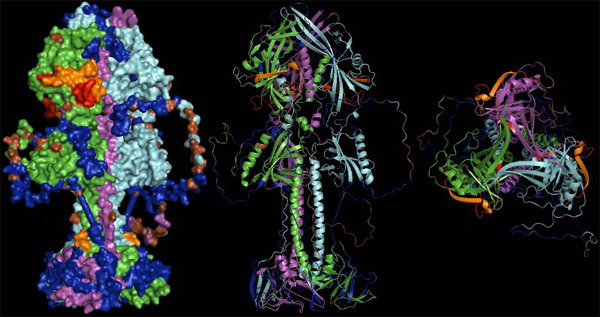
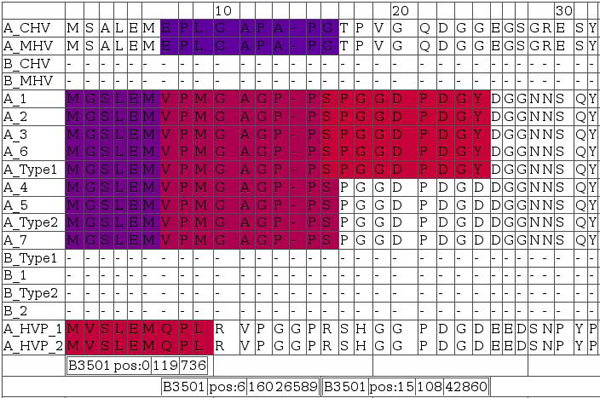
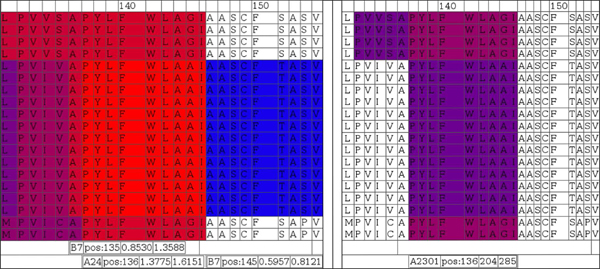
Results: We introduce pBone/pView as a computational workflow supporting design and execution of immunoinformatics workflow modules, additionally involving aspects of results visualization, knowledge sharing and re-use. Specific elements of the workflow involve identification of vaccine targets in the realm of a Systems Biology assessment of host-pathogen interaction for identifying functionally relevant targets, as well as various methodologies for delineating B- and T-cell epitopes with particular emphasis on broad coverage of viral isolates as well as MHC alleles.Applying the workflow on EBV specifically proposes sequences from the viral proteins LMP2, EBNA2 and BALF4 as vaccine targets holding specific B- and T-cell epitopes promising broad strain and allele coverage.
Conclusion: Based on advancements in the experimental assessment of genomes, transcriptomes and proteomes for both, pathogen and (human) host, the fundaments for rational design of vaccines have been laid out. In parallel, immunoinformatics modules have been designed and successfully applied for supporting specific aspects in vaccine design. Joining these advancements, further complemented by novel vaccine formulation and delivery aspects, have paved the way for implementing computational vaccinology for rational vaccine design tackling presently unmet vaccine challenges.
Figures
Similar articles
-
Immunoinformatics design of a novel epitope-based vaccine candidate against dengue virus.Sci Rep. 2021 Oct 5;11(1):19707. doi: 10.1038/s41598-021-99227-7. Sci Rep. 2021. PMID: 34611250 Free PMC article.
-
Design of a multi-epitope vaccine against six Nocardia species based on reverse vaccinology combined with immunoinformatics.Front Immunol. 2023 Feb 2;14:1100188. doi: 10.3389/fimmu.2023.1100188. eCollection 2023. Front Immunol. 2023. PMID: 36845087 Free PMC article.
-
The use of databases, data mining and immunoinformatics in vaccinology: where are we?Expert Opin Drug Discov. 2018 Feb;13(2):117-130. doi: 10.1080/17460441.2018.1413088. Epub 2017 Dec 11. Expert Opin Drug Discov. 2018. PMID: 29226722 Review.
-
mRNA-Based Vaccine Designing against Epstein-Barr Virus to Induce an Immune Response Using Immunoinformatic and Molecular Modelling Approaches.Int J Environ Res Public Health. 2022 Oct 11;19(20):13054. doi: 10.3390/ijerph192013054. Int J Environ Res Public Health. 2022. PMID: 36293632 Free PMC article.
-
Reverse engineering protection: A comprehensive survey of reverse vaccinology-based vaccines targeting viral pathogens.Vaccine. 2024 Apr 11;42(10):2503-2518. doi: 10.1016/j.vaccine.2024.02.087. Epub 2024 Mar 23. Vaccine. 2024. PMID: 38523003 Review.
Cited by
-
Study of circulating IgG antibodies to peptide antigens derived from BIRC5 and MYC in cervical cancer.FEBS Open Bio. 2015 Mar 17;5:198-201. doi: 10.1016/j.fob.2015.03.007. eCollection 2015. FEBS Open Bio. 2015. PMID: 25853035 Free PMC article.
-
HPVdb: a data mining system for knowledge discovery in human papillomavirus with applications in T cell immunology and vaccinology.Database (Oxford). 2014 Apr 4;2014:bau031. doi: 10.1093/database/bau031. Print 2014. Database (Oxford). 2014. PMID: 24705205 Free PMC article.
-
Vaccines Meet Big Data: State-of-the-Art and Future Prospects. From the Classical 3Is ("Isolate-Inactivate-Inject") Vaccinology 1.0 to Vaccinology 3.0, Vaccinomics, and Beyond: A Historical Overview.Front Public Health. 2018 Mar 5;6:62. doi: 10.3389/fpubh.2018.00062. eCollection 2018. Front Public Health. 2018. PMID: 29556492 Free PMC article. Review.
-
Are circulating autoantibodies to ABCC3 transporter a potential biomarker for lung cancer?J Cancer Res Clin Oncol. 2012 Oct;138(10):1737-42. doi: 10.1007/s00432-012-1260-9. Epub 2012 Jun 15. J Cancer Res Clin Oncol. 2012. PMID: 22699933 Free PMC article.
-
Antidotes, antibody-mediated immunity and the future of pharmaceutical product development.Hum Vaccin Immunother. 2013 Feb;9(2):294-9. doi: 10.4161/hv.22858. Epub 2013 Jan 4. Hum Vaccin Immunother. 2013. PMID: 23291934 Free PMC article. Review.
References
-
- Hopp TP. Retrospective: 12 years of antigenic determinant predictions, and more. Peptide Research. 1993;6:183–190. - PubMed
-
- Greenbaum JA, Kotturi MF, Kim Y, Oseroff C, Vaughan K, Salimi N, Vita R, Ponomarenko J, Scheuermann RH, Sette A, Peters B. Pre-existing immunity against swine-origin H1N1 influenza viruses in the general human population. Proceedings of the National Academy of Sciences of the United States of America. 2009;106:20365–20370. doi: 10.1073/pnas.0911580106. - DOI - PMC - PubMed
-
- Nielsen M, Lundegaard C, Blicher T, Lamberth K, Harndahl M, Justesen S, Røder G, Peters B, Sette A, Lund O, Buus S. NetMHCpan, a method for quantitative predictions of peptide binding to any HLA-A and -B locus protein of known sequence. PloS One. 2007;2:e796. doi: 10.1371/journal.pone.0000796. - DOI - PMC - PubMed
-
- Flower DR. Bioinformatics for Vaccinology. 1. Wiley; 2008.
LinkOut - more resources
Full Text Sources
Research Materials