. 2010;12(6):R94.
doi: 10.1186/bcr2773. Epub 2010 Nov 10.

Identification of a stem-like cell population by exposing metastatic breast cancer cell lines to repetitive cycles of hypoxia and reoxygenation

Affiliations

Identification of a stem-like cell population by exposing metastatic breast cancer cell lines to repetitive cycles of hypoxia and reoxygenation

Elizabeth Louie et al. Breast Cancer Res. 2010.

Abstract

Introduction: The irregular vasculature of solid tumors creates hypoxic regions, which are characterized by cyclic periods of hypoxia and reoxygenation. Accumulated evidence suggests that chronic and repetitive exposure to hypoxia and reoxygenation seem to provide an advantage to tumor growth. Although the development of hypoxia tolerance in tumors predicts poor prognosis, mechanisms contributing to hypoxia tolerance remain to be elucidated. Recent studies have described a subpopulation of cancer stem cells (CSC) within tumors, which have stem-like properties such as self-renewal and the ability to differentiate into multiple cell types. The cancer stem cell theory suggests CSCs persist in tumors as a distinct population and cause relapse and metastasis by giving rise to new tumors. Since hypoxia is considered to be one of the critical niche factors to promote invasive growth of tumors, we hypothesize that repetitive cycles of hypoxia/reoxygenation also play a role in the enrichment of breast CSCs.

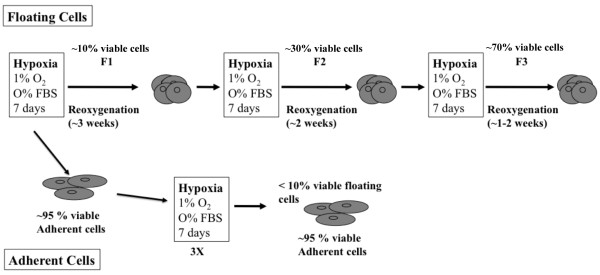
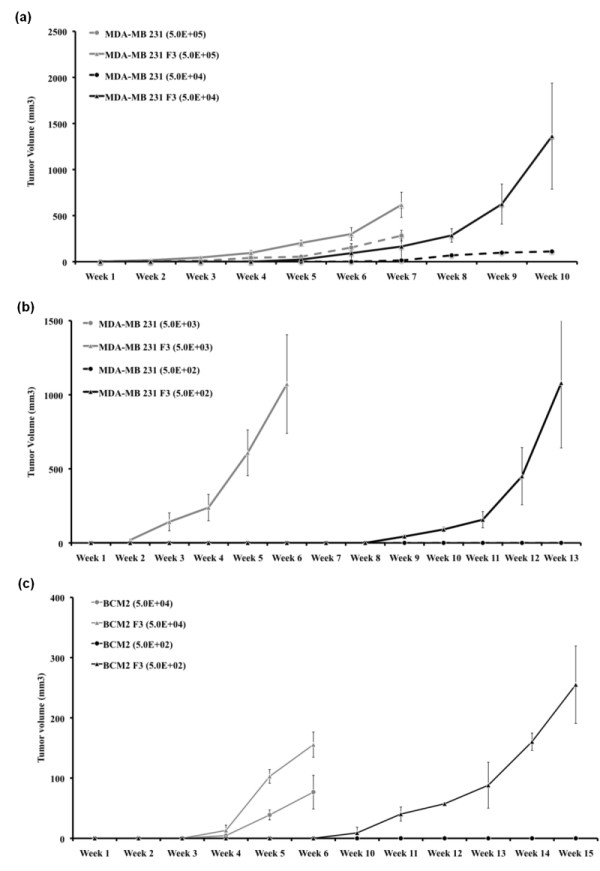
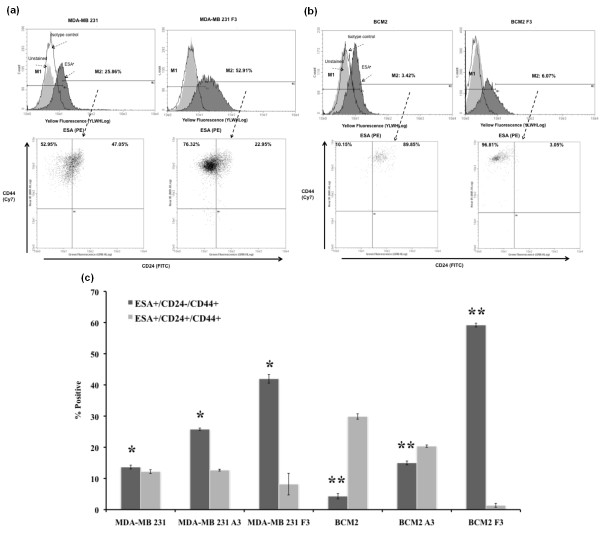
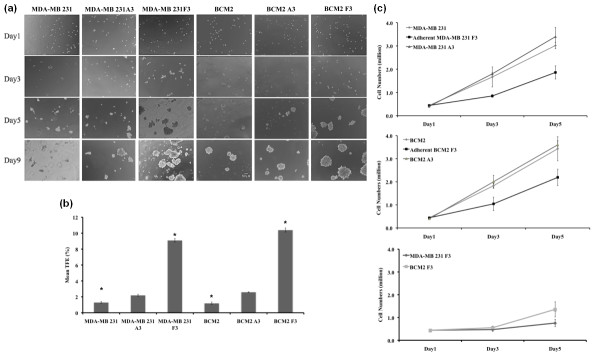
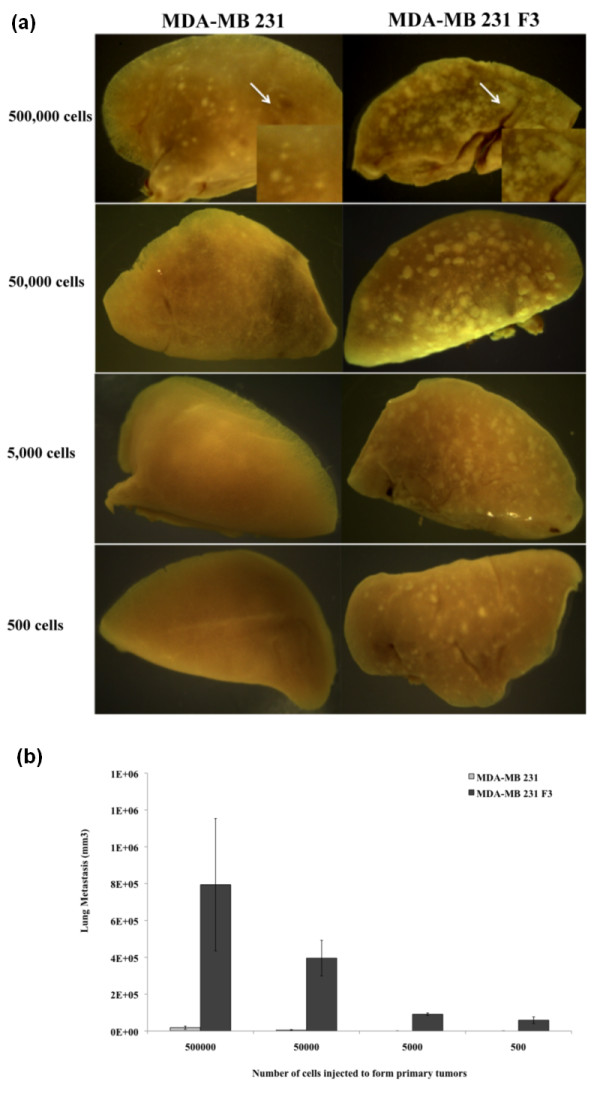
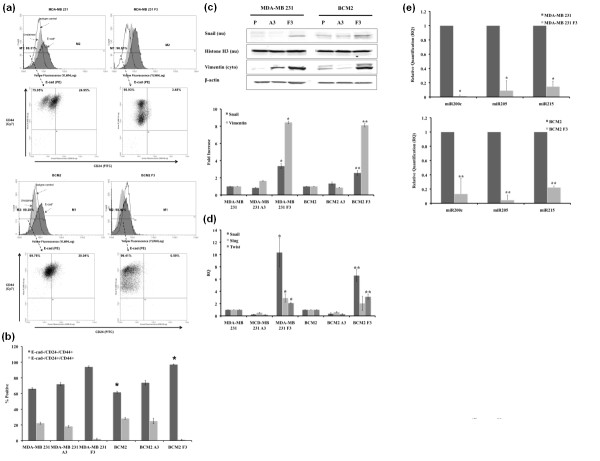
Methods: Two metastatic human breast cancer cell lines (MDA-MB 231 and BCM2) were used to optimize the conditions of hypoxia and reoxygenation cycles. The percentage of CSCs in the cycling hypoxia selected subpopulation was analyzed based on the CD44, CD24, ESA, and E-cadherin expression by three-color flow cytometry. Colony formation assays were used to assess the ability of this subpopulation to self-renew. Limiting dilution assays were performed to evaluate the tumor-initiating and metastatic ability of this subpopulation. Induction of EMT was examined by the expression of EMT-associated markers and EMT-associated microRNAs.

Results: Using an optimized hypoxia and reoxygenation regimen, we identified a novel cycling hypoxia-selected subpopulation from human breast cancer cell lines and demonstrated that a stem-like breast cancer cell subpopulation could be expanded through repetitive hypoxia/reoxygenation cycles without genetic manipulation. We also found that cells derived from this novel subpopulation form colonies readily, are highly tumorigenic in immune-deficient mice, and exhibit both stem-like and EMT phenotypes.

Conclusions: These results provide the validity to the newly developed hypoxia/reoxygenation culture system for examining the regulation of CSCs in breast cancer cell lines by niche factors in the tumor microenvironment and developing differential targeting strategies to eradicate breast CSCs.


Figures

Figure 1
Figure 1
An illustration of the hypoxia and reoxygenation regimen. Conditions for hypoxia/reoxygenation cycles were optimized using two human metastatic breast cancer cell lines (MDA-MB 231 and BCM2). The viability of non-adherent cells is listed after each hypoxic cycle. FBS, fetal bovine serum.
Figure 2
Figure 2
Growth curves of primary tumors generated from the parental cell lines and cycling hypoxia-selected subpopulations. (a) Growth curves of primary tumors in non-obese diabetic/severe combined immunodeficiency disease (NOD/SCID) mice injected with 5 × 10⁵ or 5 × 10⁴ MDA-MB 231 and MDA-MB 231 F3 cells. Tumors were first detected by palpation. Standard errors are derived from duplicate experiments (n = 6 per cell number for each experiment). (b) Growth curves of tumors in NOD/SCID mice injected with 5 × 10³ or 5 × 10² MDA-MB 231 and MDA-MB 231 F3 cells. Standard errors were derived from duplicate experiments (n = 5 per cell number for each experiment). (c) Growth curves of tumors in NOD/SCID mice injected with 5 × 10⁴ or 5 × 10² BCM2 and BCM2 F3 cells. Standard errors were derived from duplicate experiments (n = 5 per cell number for each experiment).
Figure 3
Figure 3
Cell surface expression of ESA, CD44, and CD24. Three-color flow cytometry analysis was performed to detect the CD44+/CD24-/ESA+ cell population. (a) Top panel: Unstained, isotype control, and ESA-stained cells are shown in the histogram. ESA staining of MDA-MB 231 (total cell population) and MDA-MB 231 F3 (cycling hypoxia-selected subpopulation) cells. M1 marker gates ESA+ cells, and M2 marker gates the ESA- cells. Bottom panel: CD44 and CD24 expression of ESA+ cells in each cell line. The percentages of the CD44+/CD24- and CD44+/CD24+ cells within the ESA+ cell population are indicated in the Quad plot. (b) The same flow cytometry analysis for BCM2 (total cell population) and BCM2 F3 (cycling hypoxia-selected subpopulation) cells. (c) Quantitative comparison of CD44+/CD24-/ESA+ cell population and CD44+/CD24+/ESA+ cell population in cycling hypoxia-selected subpopulations (MDA-MB 231 F3 and BCM2 F3) and their parental breast cancer cell lines. At least three replications were performed to derive the average percentage of each cell population in each cell line and standard deviations. Asterisks indicate statistical significance by two-tail t test (n = 3, P < 0.05). ESA, epithelial-specific antigen.
Figure 4
Figure 4
The colony formation and proliferation of the parent cell lines and the cycling hypoxia-selected subpopulations. (a) Images of colony formation assays from 500 cells of MDA-MB 231, MDA-MB 231 A3, MDA-MB F3, BCM2, BCM2 A3, and BCM2 F3 on days 1, 3, 5, and 9. Representative images from three separate experiments are shown. (b) Colony-forming efficiency (CFE) of parental cells, hypoxia-exposed adherent cells (MDA-MB 231 A3 and BCM2 A3), and the cycling hypoxia-selected subpopulations (MDA-MB 231 F3 and BCM2 F3). CFE was determined when tumor spheres were larger than 60 μm in diameter on day 9 after plating. CFE was calculated by dividing the number of tumor spheres formed by the original number of single cells seeded and is expressed as a percentage. Three independent experiments were performed to derive the average CFE and standard deviation per cell line. Asterisk indicates statistical significance by two-tail t test (n = 3, P < 0.05). (c) Proliferation curves of the parental cells, hypoxia-exposed cells (A3), and the cycling hypoxia-selected subpopulations grown as adherent cultures (top two plots) or as spherical cultures (the third plot). Total viable cells from each well at days 3 and 5 were counted by the ViaCount assay using the Guava Flow Cytometer. Average cell numbers and standard deviations at each time point were calculated from three independent experiments.
Figure 5
Figure 5
Lung metastases from the tumor-initiating assays. (a) Representative images of lungs from tumor-bearing non-obese diabetic/severe combined immunodeficiency disease (NOD/SCID) mice are shown (n = 6). A higher magnification of lung metastases derived from orthotopic injection of 5 × 10⁵ MDA-MB 231 or MDA-MB 231 F3 cells is shown in the lower right corner. (b) Quantitative analysis of the metastatic tumor burden in the lung. Images of lungs were taken using a digital microscope camera. Images were imported into the National Institutes of Health ImageJ software for quantitative analysis. The sum of metastatic tumor volume was first calculated from four lobes of lungs per animal (see Materials and methods), and the lung metastasis per group is presented as tumor volume (cubic millimeters). The number of animals used per group is listed in Table 1.
Figure 6
Figure 6
Expression of epithelial-mesenchymal transition (EMT)-associated markers in the total cell population and the cycling hypoxia-selected subpopulation. (a) Three-color fluorescence-activated cell sorting (FACS) analysis was performed to detect CD44CD24 expression profile on the E-cadherin-negative cell population. Unstained, isotype control, and E-cadherin (E-cad)-stained cells are shown in the histogram. ESA staining of MDA-MB 231 (total cell population) and MDA-MB 231 F3 (cycling hypoxia-selected subpopulation) cells is shown. M1 marker gates E-cadherin-positive cells, and M2 marker gates the E-cadherin-negative cells. Bottom panel: CD44 and CD24 expression of E-cadherin-negative cells in each cell line. The percentages of the CD44+/CD24- and CD44+/CD24+ cells are indicated in the Quad plot. (b) Quantitative comparison of E-cad-/CD44+/CD24- cell population and E-cad-/CD44+/CD24+ cell population in cycling hypoxia-selected subpopulations (MDA-MB 231 F3 and BCM2 F3) and their parental breast cancer cell lines. At least three replications were performed to derive the average percentage of each cell population in each cell line and standard deviations among the replicates. (c) Expression of EMT-associated proteins in the parental cells (P), hypoxia-exposed adherent cells (A3), and the cycling hypoxia-selected subpopulations (F3). Lysates from these two cell populations were fractionated on the basis of the subcellular localization using the ProteoExtract Kit, and 40 μg of proteins was loaded for Western blotting. Beta-actin is used as the loading control for the cytoplasmic fraction, and histone H3 is used as the loading control for the nuclear fraction. Western blot images (n = 3) are quantified by National Institutes of Health ImageJ software and presented as fold increase in A3 and F3 cells compared with the parental cell lines. (d) mRNA regulation of EMT transcription factors in the parental, A3, and F3 cells. Quantitative reverse transcription-polymerase chain reaction (qRT-PCR) analyses were performed using specific primers to measure the mRNA expression of human Snail, Slug, and Twist genes in these three cell populations. At least three replications (n = 3) were performed to derive the average percentage of each cell population in each cell line and standard deviations among the replicates. (e) Expression of EMT-suppressing microRNAs (miRNAs) in the parental, A3, and F3 cells. qRT-PCR analyses were performed using specific primers to measure the expression of miR200c and miR205. At least three replications (n = 3) were performed to derive the average percentage of each cell population in each cell line and standard deviations among the replicates. Asterisks indicate statistical significance by two-tail t test (P < 0.05) for all quantitative results. ESA, epithelial-specific antigen.

Similar articles

Cited by

References

    1. Al-Hajj M, Wicha MS, Benito-Hernandez A, Morrison SJ, Clarke MF. Prospective identification of tumorigenic breast cancer cells. Proc Natl Acad Sci USA. 2003;100:3983–3988. doi: 10.1073/pnas.0530291100. - DOI - PMC - PubMed
    1. Horst D, Scheel SK, Liebmann S, Neumann J, Maatz S, Kirchner T, Jung A. The cancer stem cell marker CD133 has high prognostic impact but unknown functional relevance for the metastasis of human colon cancer. J Pathol. 2009;219:427–434. doi: 10.1002/path.2597. - DOI - PubMed
    1. Ghosh N, Matsui W. Cancer stem cells in multiple myeloma. Cancer Lett. 2009;277:1–7. doi: 10.1016/j.canlet.2008.08.005. - DOI - PMC - PubMed
    1. Bednar F, Simeone DM. Pancreatic cancer stem cells and relevance to cancer treatments. J Cell Biochem. 2009;107:40–45. doi: 10.1002/jcb.22093. - DOI - PubMed
    1. Wright MH, Calcagno AM, Salcido CD, Carlson MD, Ambudkar SV, Varticovski L. Brca1 breast tumors contain distinct CD44+/CD24- and CD133+ cells with cancer stem cell characteristics. Breast Cancer Res. 2008;10:R10. doi: 10.1186/bcr1855. - DOI - PMC - PubMed

Publication types

MeSH terms