Randomized Controlled Trial
. 2011 Feb;52(2):361-73.
doi: 10.1194/jlr.M011098. Epub 2010 Nov 10.

Treatment of patients with cardiovascular disease with L-4F, an apo-A1 mimetic, did not improve select biomarkers of HDL function

Affiliations
Randomized Controlled Trial

Treatment of patients with cardiovascular disease with L-4F, an apo-A1 mimetic, did not improve select biomarkers of HDL function

Catherine E Watson et al. J Lipid Res. 2011 Feb.

Abstract

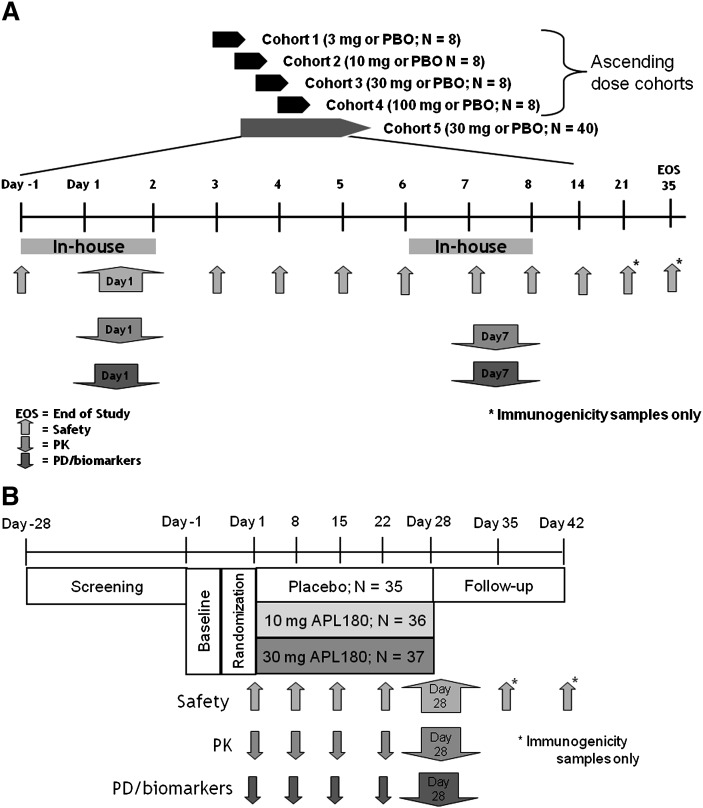
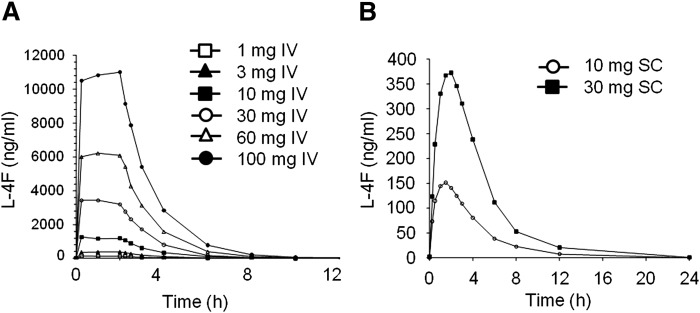
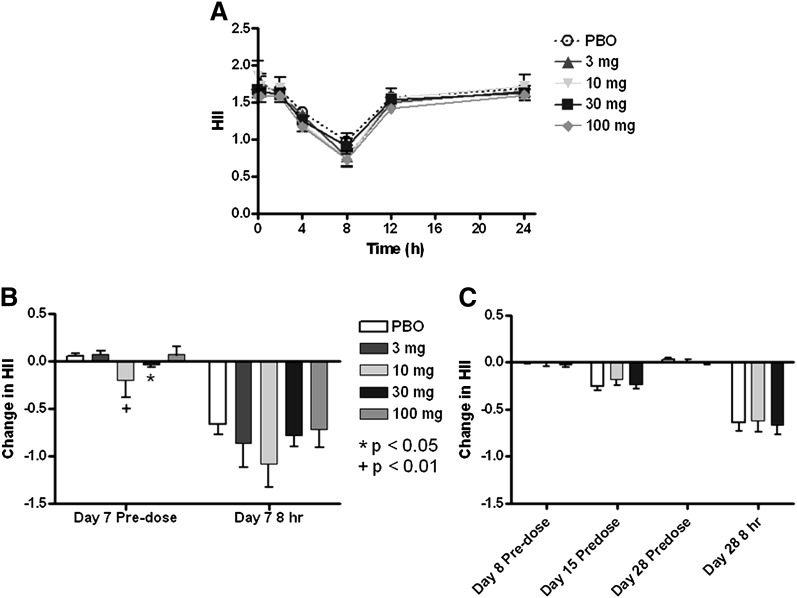
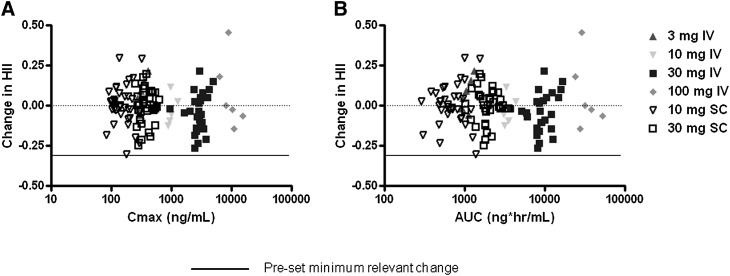
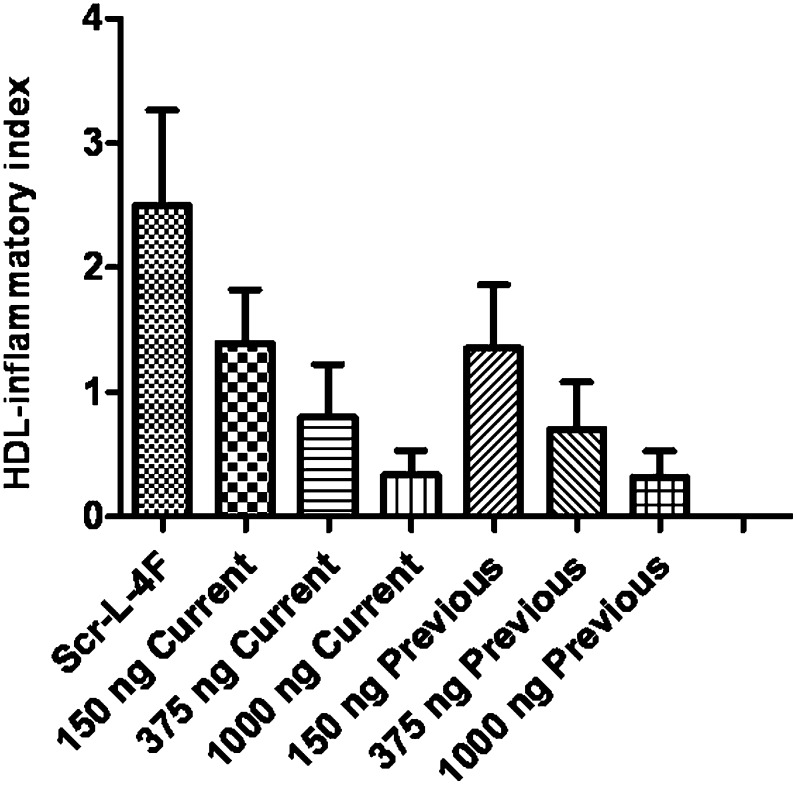
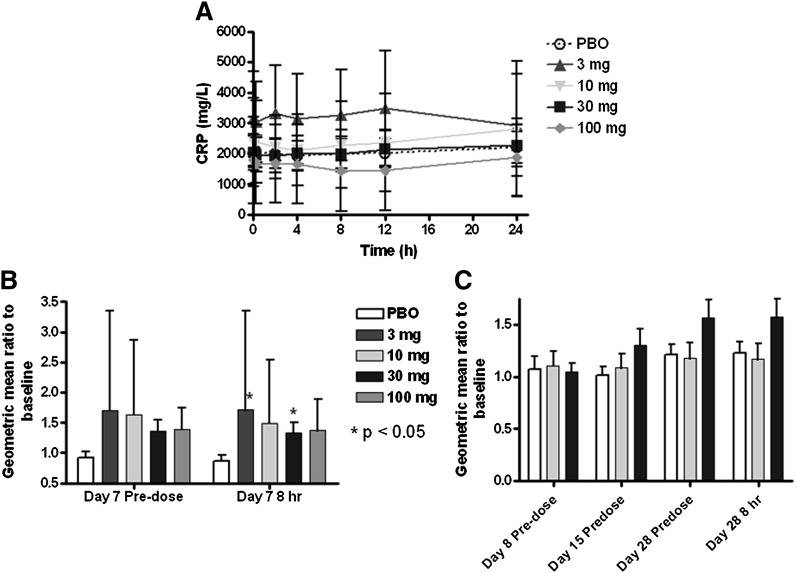
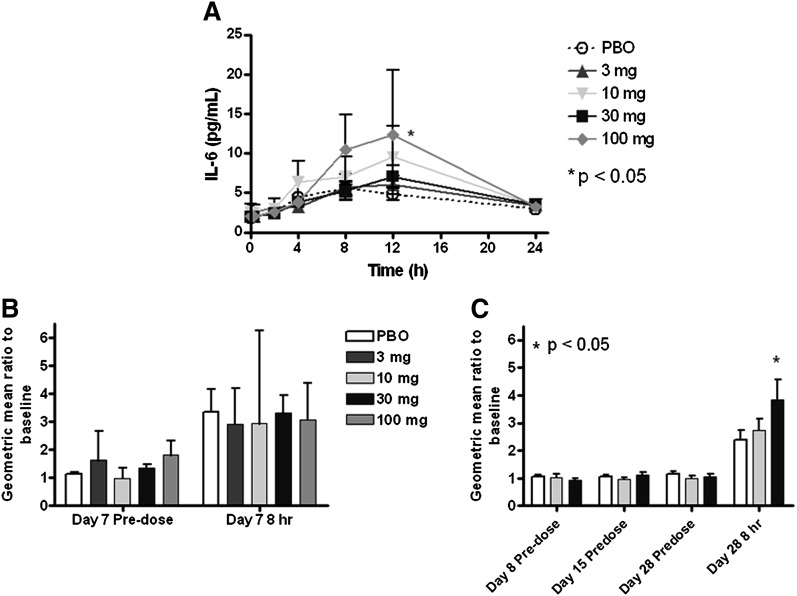
L-4F, an apolipoprotein A-I (apoA-I) mimetic peptide (also known as APL180), was administered daily by either intravenous (IV) infusion for 7 days or by subcutaneous (SC) injection for 28 days in patients with coronary heart disease in two distinct clinical studies. L-4F was well tolerated at all doses tested. Despite achieving plasma levels (mean maximal plasma concentration of 2,907 ng/ml and 395 ng/ml, following IV infusion and SC injection, respectively), that were effective in previously published animal models, treatment with L-4F, as assessed by biomarkers of HDL function such as HDL-inflammatory index (HII), and paraoxonase activity, did not improve. Paradoxically, there was a 49% increase in high-sensitivity C-reactive protein (hs-CRP) levels after seven IV infusions of 30 mg L-4F (P < 0.05; compared with placebo) and a trend for hs-CRP increase in subjects receiving 30 mg SC injection for 28 days. In a subsequent, ex vivo study, addition of L-4F at concentrations of 150, 375, or 1,000 ng/ml to plasma from subjects prior to L-4F treatment resulted in significant dose-dependent HII improvement. In conclusion, in vivo L-4F treatment, delivered by either SC injection or IV infusion, did not improve HDL functional biomarkers despite achieving plasma levels that improved identical biomarkers ex vivo and in animal models.


Figures

Fig. 1.
Fig. 1.
Study design schematics for intravenous (IV) and subcutaneous (SC) studies. A: Overview of APL1802201, a randomized, double-blinded, placebo-controlled, ascending multiple-dose study of L-4F given as daily IV infusions for 7 consecutive days. B: Overview of APL1802210B, a parallel, randomized, double-blind, placebo-controlled, multiple-dose study of L-4F given as daily SC injections for 28 days. PBO, placebo.
Fig. 2.
Fig. 2.
Reproducibility of the HDL-inflammatory index (HII) for samples obtained on different days. The HII values obtained at each time point on the first and seventh days following infusion (time points assayed after infusion were 15 min, 2 h, 4 h, 8 h, 12 h, and 24 h) for the four subjects described in Table 2 were divided by the predose HII value on the first and seventh days, respectively, and plotted against each other. The regression line is shown as a solid black line. The slope of the line = 0.9376; y intercept = 0.0272; x intercept = −0.02901.
Fig. 3.
Fig. 3.
Pharmacokinetics of L-4F following IV and SC administration. The plasma levels of L-4F increased proportional to dose during the 2 h IV infusion of 3–100 mg (A) and following the SC injection of 10 or 30 mg (B). The values shown are the average for the subjects described in Tables 2 and 3.
Fig. 4.
Fig. 4.
HII following IV and SC administration of L-4F. HII decreased over 8 h following a single IV infusion of L-4F and placebo (A). Although a few statistically significant decreases compared with placebo were observed in the HII following six or more IV doses (B), the reductions were minimal (≤0.1), and no dose response was evident. No decrease in HII relative to day 1 predose was observed following multiple SC injections of L-4F (C). The data shown are mean ± SEM. PBO, placebo.
Fig. 5.
Fig. 5.
Scatter plot of exposure on change in HII. Change in HII from predose day 1 to predose day 7 (IV) or day 28 (SC) for each subject (y axis) was plotted as a function of L-4F exposure achieved (x axis) as measured by maximal plasma concentration (Cmax) (A) or area under the curve (AUC) (B). No dose–response or exposure–response relationship was observed.
Fig. 6.
Fig. 6.
Ex vivo incubation of L-4F to plasma from CHD subjects. Predose plasma samples from day 2 of the SC study were randomly chosen from 20 subjects in the study. Each plasma sample was incubated in vitro for 15 min at 37°C with 1,000 ng/ml of scrambled L-4F (Scr-L-4F) or 150 ng/ml, 375 ng/ml or 1,000 ng/ml of the L-4F peptide that was used in the clinical studies described here (Current) or L-4F peptide that had been used in previously published preclinical studies (, ; Previous). The plasma samples were then separated by fast-protein liquid chromatography (FPLC), and the HDL fractions were added to cultures of human aortic endothelial cells to determine the HII, as described in Materials and Methods. The data shown are mean ± SD. There was no difference in HII between the two sources of peptides. A similar dose-dependent improvement (decrease) in HII was observed after ex vivo addition of both peptides.
Fig. 7.
Fig. 7.
High-sensitivity C-reactive protein (hs-CRP) following IV and SC administration of L-4F. A single IV infusion of L-4F did not alter hs-CRP levels (A). A trend for increase in hs-CRP was observed for all doses at trough on day 7 (B), although these did not reach statistical significance (P < 0.1, but > 0.05). The increases were statistically higher compared with placebo for the IV 3 and 30 mg groups compared with placebo at 8 h postdose on day 7 (B). A similar, but nonsignificant trend toward an increase in hs-CRP levels was observed after daily SC administration of 30 mg (but not 10 mg) of L-4F (C). Geometric mean ± SEM are given in A, and geometric mean ratio ± SEM are given in B and C. PBO, placebo.
Fig. 8.
Fig. 8.
Interleukin-6 (IL-6) following IV and SC administration of L-4F. A postdose increase in IL-6 was observed following single IV doses of both L-4F and placebo (A), but only reached statistical significance for the 100 mg dose at 12 h postdose. No change in IL-6 compared with placebo was observed at any dose level prior to (predose) or 8 h after the seventh IV dose (B). There were no predose increases in IL-6 levels with either 10 or 30 mg L-4F at any time during the SC study compared with placebo (C). However, after dosing on day 28 in the SC study, there was a significant increase in IL-6 levels 8 h after the 30 mg dose of L-4F, compared with placebo. Geometric mean ± SEM are given in A, and geometric mean ratio ± SEM are given in B and C. PBO, placebo.

Similar articles

Cited by

References

    1. Gordon T., Castelli W. P., Hjortland M. C., Kannel W. B., Dawber T. R. 1977. High density lipoprotein as a protective factor against coronary heart disease. Am. J. Med. 62: 707–714. - PubMed
    1. Navab M., Reddy S. T., Van Lenten B. J., Anantharamaiah G. M., Fogelman A. M. 2009. The role of dysfunctional HDL in atherosclerosis. J. Lipid Res. 50 (Suppl.): 145–149. - PMC - PubMed
    1. Navab M., Anantharamaiah G. M., Reddy S. T., Van Lenten B. J., Fogelman A. M. 2009. HDL as a biomarker, potential therapeutic target and therapy. Diabetes. 58: 2711–2717. - PMC - PubMed
    1. Navab M., Shechter I., Anantharamaiah G. M., Reddy S. T., Van Lenten B. J., Fogelman A. M. 2010. Structure and function of HDL mimetics. Arterioscler. Thromb. Vasc. Biol. 30: 164–168. - PMC - PubMed
    1. Bloedon L. T., Dunbar R., Duffy D., Pinell-Salles P., Norris R., DeGroot B. J., Movva R., Navab M., Fogelman A. M., Rader D. J. 2008. Safety, pharmacokinetics and pharmacodynamics of oral apoA-I mimetic peptide D-4F in high-risk cardiovascular patients. J. Lipid Res. 49: 1344–1352. - PMC - PubMed

Publication types