. 2011 Apr 6;8(57):506-17.
doi: 10.1098/rsif.2010.0491. Epub 2010 Nov 10.

A dynamic dose-response model to account for exposure patterns in risk assessment: a case study in inhalation anthrax

Affiliations

A dynamic dose-response model to account for exposure patterns in risk assessment: a case study in inhalation anthrax

Bryan T Mayer et al. J R Soc Interface. .

Abstract

The most commonly used dose-response models implicitly assume that accumulation of dose is a time-independent process where each pathogen has a fixed risk of initiating infection. Immune particle neutralization of pathogens, however, may create strong time dependence; i.e. temporally clustered pathogens have a better chance of overwhelming the immune particles than pathogen exposures that occur at lower levels for longer periods of time. In environmental transmission systems, we expect different routes of transmission to elicit different dose-timing patterns and thus potentially different realizations of risk. We present a dose-response model that captures time dependence in a manner that incorporates the dynamics of initial immune response. We then demonstrate the parameter estimation of our model in a dose-response survival analysis using empirical time-series data of inhalational anthrax in monkeys in which we find slight dose-timing effects. Future dose-response experiments should include varying the time pattern of exposure in addition to varying the total doses delivered. Ultimately, the dynamic dose-response paradigm presented here will improve modelling of environmental transmission systems where different systems have different time patterns of exposure.


Figures

Figure 1.
Figure 1.
The shape and rate of within host dose decay by levels of α and γ. While the shape of decay is dependent only on α, the rate of decay is dependent on both α and γ. (a) Dose over time (γ = 2); (b) dose over time (γ = 0.5). Dotted line, α = 1; grey line, α = 0.75; dashed line, α = 0.5; thin line, α = 0.25; thick line, α = 0.
Figure 2.
Figure 2.
(a,b) Example of two different inoculation patterns (c,d) and the time evolution of pathogen numbers within the host. The model's parameters are α = 0.5 and γ = 0.05. The patterns of inoculation correspond to two different multiple inoculation scenarios: (a) 20 inoculation events of two pathogens each, (b) and four inoculation events of 10 pathogens each. Although the total inoculated dose (40 pathogens) and the time of exposure (200 min) is the same, it is visually evident that pathogens from the four inoculation events persist longer in the immune system. (Online version in colour.)
Figure 3.
Figure 3.
Exposure (left axis and represented by lighter bars with width of 1 day) and Mortality (right axis and represented by black thin bars) results from the third and fourth runs of the anthrax dataset. Exposure is assumed to be given uniformly once every hour on days when exposures were recorded. In the third run, 12/32 monkeys died from anthrax, and in the fourth run, 10/31 monkeys died from anthrax. (a,b) Thin light blue lines, dose; thick black lines, deaths. (Online version in colour.)
Figure 4.
Figure 4.
Results from the Brachman inhalational anthrax data analysis. (a) Results from optimization profile over α. A spline curve was fit to determine the minimum negative log likelihood (MLE α = 0.90) and to determine the 95% CI (0.51, 1) using the log likelihood ratio test. (b) Optimized s values for values of α within its 95% CI. (c) Optimized log(γ) values for values of α within its 95% CI. The minimum γ value in this range is 0.0046 h−1 and the maximum is 0.17 h−1. (d) Predicted risks for two exposure patterns using MLE values profiled over α. Two exposure scenarios were used, one bolus and one evenly distributed exposure pattern, both with the same total dose of 15 000. Parameter sets used for these calculations are (α = 0.50, s = 1.65 × 10⁻⁷ h−1, γ = 0.20 h−1); (α = 0.60, s = 1.72 × 10⁻⁷ h−1, γ = 0.093 h−1); (α = 0.70, s = 1.76 × 10⁻⁷ h−1, γ = 0.044 h−1); (α = 0.80, s = 1.78 × 10⁻⁷ h−1, γ = 0.021 h−1); (α = 0.90, s = 1.81 × 10⁻⁷ h−1, γ = 0.0097 h−1); and (α = 1.00, s = 1.84 × 10⁻⁷ h−1, γ = 0.0046 h−1). (d) Circles, exposure pattern 1 (bolus); crosses, exposure pattern 2 (evenly distributed).
Figure 5.
Figure 5.
Comparison of our best-fit results with other anthrax models when modelling risk for a single bolus dose. To calculate this risk when α = 0.9, equations (2.6) and (2.9) were used in combination with MLE values, s = 1.81 × 10⁻⁷ h−1 and γ = 0.001 h−1. When α = 1, our model is equivalent to an exponential model with k = s/γ = 3.57 × 10⁻⁵. Previous exponential modelling of Brachman data assuming each day as an independent dosing event yielded k = 2.4 × 10⁻⁵ [15]. A model of anthrax outbreak in Rhesus monkeys which included clearance rate and hazard rate yielded an attack rate formula equivalent to an exponential model with k = 7.17 × 10⁻⁵ [10]. Thick line, Brachman results formula image
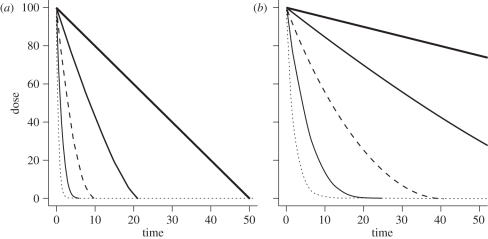
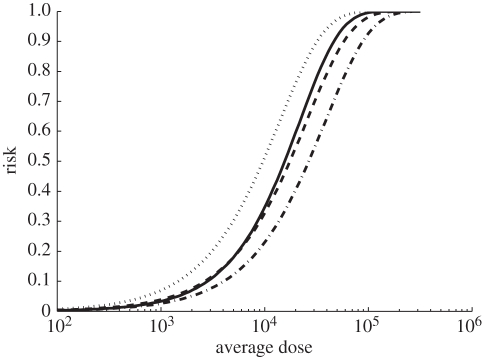
; dashed line, Brachman results α = 1; dash-dotted line, Brachman results [15]; dotted line, Brookmeyer et al. [10].

References

    1. Haas C. N., Rose J. B., Gerba C. P. 1999. Quantitative microbial risk assessment. New York, NY: John Wiley
    1. Haas C. N. 1983. Estimation of risk due to low doses of microorganisms: a comparison of alternative methodologies. Am. J. Epidemiol. 118, 1097–1100 - PubMed
    1. Haas C. N. 1996. How to average microbial densities to characterize risk. Water Res. 30, 1036–103810.1016/0043-1354(95)00228-6 (doi:10.1016/0043-1354(95)00228-6) - DOI - DOI
    1. Pujol J. M., Eisenberg J. E., Haas C. N., Koopman J. S. 2009. The effect of ongoing exposure dynamics in dose response relationships. PLoS Comput. Biol. 5, e1000399.10.1371/journal.pcbi.1000399 (doi:10.1371/journal.pcbi.1000399) - DOI - DOI - PMC - PubMed
    1. Brachman P. S., Kaufman A. F., Dalldorf F. G. 1966. Industrial inhalation Anthrax. Bacteriol. Rev. 30, 646–659 - PMC - PubMed

Publication types

Supplementary concepts

LinkOut - more resources