. 2010 Dec;137(24):4147-58.
doi: 10.1242/dev.052506. Epub 2010 Nov 10.

The Hippo pathway regulates intestinal stem cell proliferation during Drosophila adult midgut regeneration

Affiliations

The Hippo pathway regulates intestinal stem cell proliferation during Drosophila adult midgut regeneration

Rachael L Shaw et al. Development. 2010 Dec.

Abstract

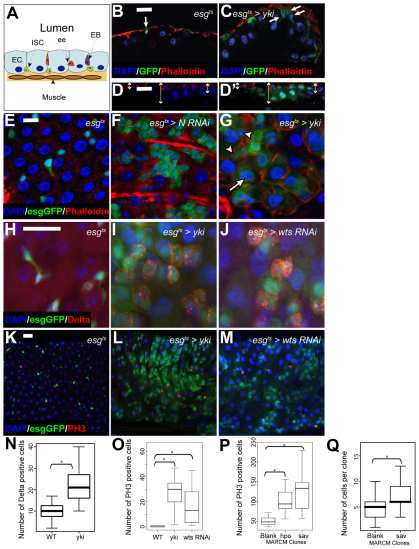
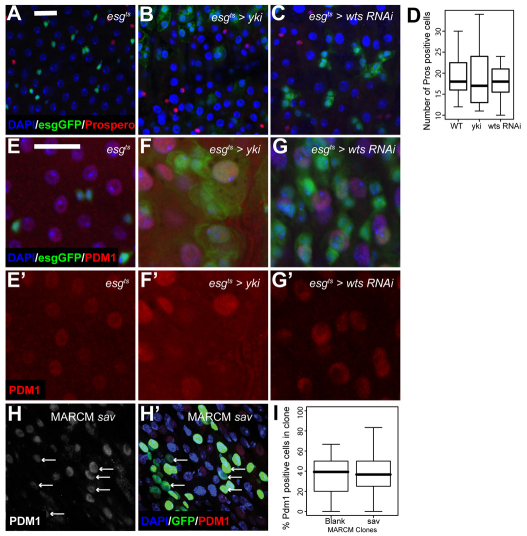
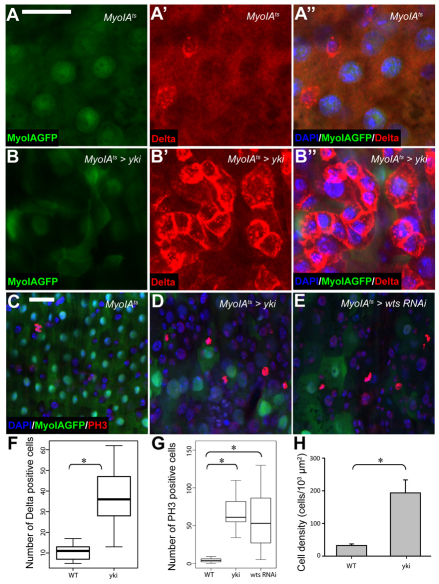
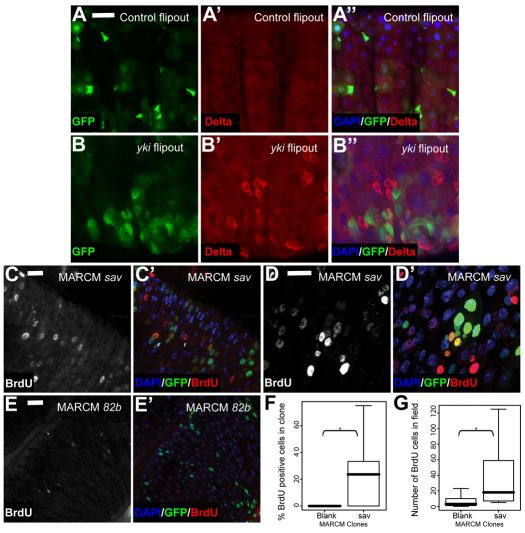
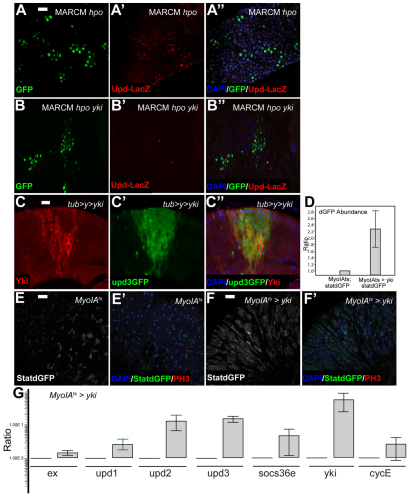
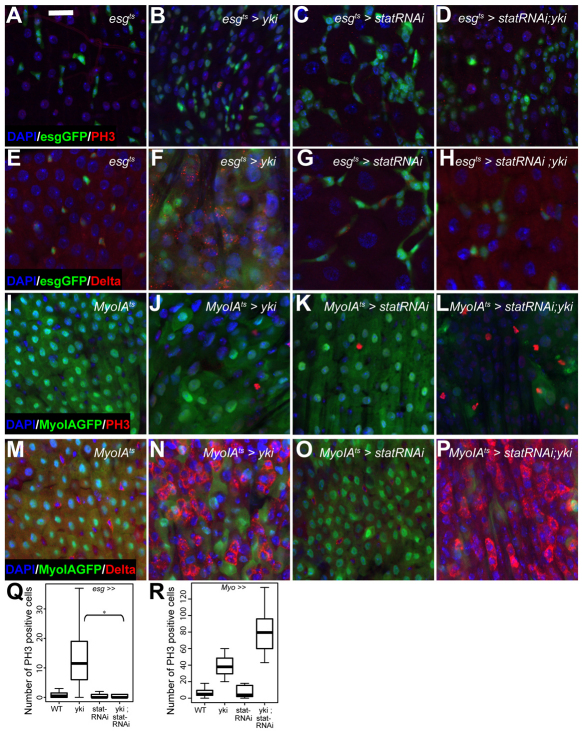
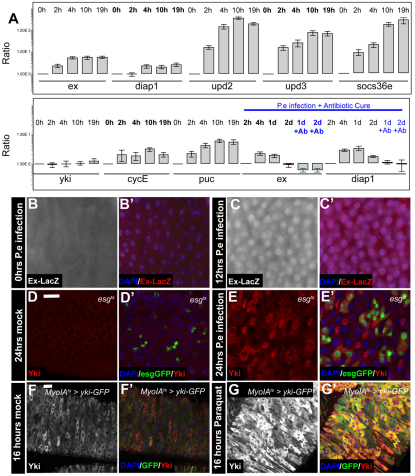
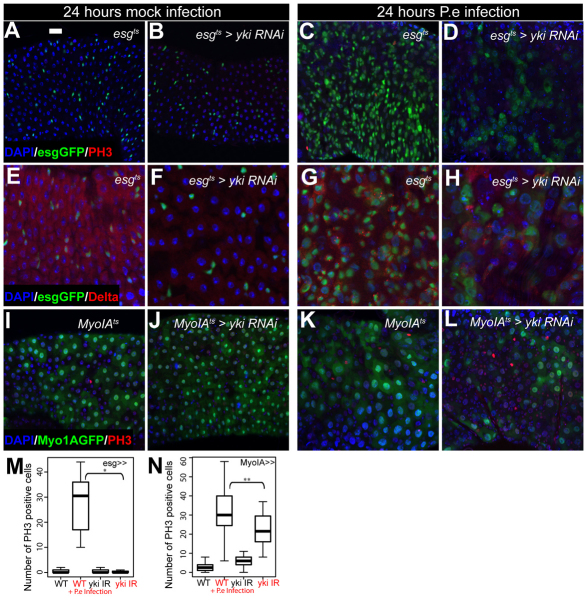
Intestinal stem cells (ISCs) in the adult Drosophila midgut proliferate to self-renew and to produce differentiating daughter cells that replace those lost as part of normal gut function. Intestinal stress induces the activation of Upd/Jak/Stat signalling, which promotes intestinal regeneration by inducing rapid stem cell proliferation. We have investigated the role of the Hippo (Hpo) pathway in the Drosophila intestine (midgut). Hpo pathway inactivation in either the ISCs or the differentiated enterocytes induces a phenotype similar to that observed under stress situations, including increased stem cell proliferation and expression of Jak/Stat pathway ligands. Hpo pathway targets are induced by stresses such as bacterial infection, suggesting that the Hpo pathway functions as a sensor of cellular stress in the differentiated cells of the midgut. In addition, Yki, the pro-growth transcription factor target of the Hpo pathway, is required in ISCs to drive the proliferative response to stress. Our results suggest that the Hpo pathway is a mediator of the regenerative response in the Drosophila midgut.


Figures

Fig. 1.
Fig. 1.
Loss of Hpo signalling promotes ISC proliferation. (A) The adult midgut. (B,C) Orthogonal cryosections of the adult midgut epithelium showing that esgts-driven expression of Yki-GFP (C) leads to increased nuclear density and the number of basally located esg+ cells (arrows) compared with control (esgts>GFP) (B). Nuclei are stained with DAPI in all panels (blue), esg+ cells are marked by GFP (green) and phalloidin staining is red. (D,D′) Orthogonal section of a 2-week-old MARCM hpo clone shows increased epithelial thickness (arrows) compared with surrounding GFP-negative control tissue. Progenitor cells are marked by armadillo (β-catenin) staining (red). Confocal micrographs of adult posterior midguts. (E-G) esgts-driven expression of Yki (G) or Notch-RNAi (F) in ISCs and EBs induces an increase in esg+ (green) cell number compared with control (E). Yki overexpression induces the appearance of esg+ cells with large nuclei (arrow), but smaller nuclei remain (arrowheads) (G, compare with E and F). Phalloidin is in red. (H-J) esgts-driven expression of Yki (I) or wts-RNAi (J) induces increased numbers of Dl+ cells compared with control (H). esg+ cells are marked by GFP (green) and Dl is in red. (K-M) esgts-driven expression of Yki (L) or wts-RNAi (M) increases the number of PH3+ cells compared with control (K). esg+ cells are marked by GFP (green) and PH3 is in red. Scale bars: 10 μm in E-G; 20 μm in B-D′,H-M. (N) Quantification of Dl+ cells. esgts-driven expression of Yki significantly increases the total number of Dl+ cells in adult midguts compared with control. P<0.001, n>10. (O) Quantification of PH3+ cells. esgts-driven expression of Yki or wts-RNAi significantly increases the total number of PH3+ cells in adult midguts compared with control. In both cases, P<0.0001, n>15. (P) hpo42-47 or savshrp1 mutant MARCM clones increased mitotic rates (PH3+ cells/gut) along the entire midgut compared with control clones. P<0.0001, n=12. (Q) Increased cell number in 7-day-old savshrp1 mutant MARCM clones (n=46) compared with neutral MARCM clones (n=74). P<0.0001.
Fig. 2.
Fig. 2.
Hpo pathway inactivation does not prevent differentiation. (A-C) esgts-driven expression of Yki (B) or wts-RNAi (C) does not alter ee cell number compared with control (A). Nuclei are stained with DAPI (blue) in all panels; esg+ cells are marked by GFP (green) and Pros is red. (D) Pros+ cell number in the indicated genotypes (n>15). (E-G′) esgts-driven expression of Yki (F,F′) or wts-RNAi (G,G′) increases EC nuclear size compared with control (E,E′). esg+ cells are marked by GFP (green) and Pdm1 marked ECs are red. (H,H′) Daughter cell differentiation to Pdm1+ ECs in sav MARCM clones after 2 weeks of clone growth (arrows). Mutant clones are marked by GFP (green) and Pdm1 is red. Scale bar: 20 μm. (I) Percentage of Pdm1+ cells per clone in 1-week-old savshrp1 mutant MARCM clones compared with neutral MARCM clones.
Fig. 3.
Fig. 3.
Hpo pathway inactivation in ECs triggers Delta expression and proliferation of ISCs. (A-B′) MyoIAts-driven expression of Yki (B-B′) in ECs induces a marked increase in the number of Dl+ cells compared with control (A-A′). Nuclei are stained with DAPI (blue) in all panels, ECs are marked by GFP (green) and Dl is red. (C-E) MyoIAts-driven expression of Yki (D) or wts-RNAi (E) in ECs induces an increase in the number of PH3+ cells compared with control (C). ECs are marked by GFP (green) and PH3 is red. Scale bars: 20 μm. (F) Quantification of Dl+ cells in the indicated genotypes *P<0.0001, n>10. (G) Quantification of PH3+ cells in the indicated genotypes *P<0.0001, n>15 guts. (H) MyoIAts-driven expression of Yki significantly increases cellularity in the posterior midgut epithelium. Cell numbers were quantified by counting all nuclei in an epithelial sheet of given surface area in the posterior midgut region after z-projection and normalization to tissue size. Data shown as mean ± s.e.m. *P<0.01, n=5 guts (>1500 nuclei).
Fig. 4.
Fig. 4.
Clonal Hpo pathway inactivation induces non cell-autonomous effects. (A-B′) Flipout clones overexpressing Yki (B-B′) induce an increase in Dl compared with control (A-A′). Nuclei are stained with DAPI (blue); GFP is green and Dl is in red. (C-E′) Cell-autonomous and non cell-autonomous increases in DNA replication rates (BrdU incorporation) upon induction of savshrp1 mutant GFP marked MARCM clones (C,C′) compared with neutral clones (E,E′). Higher magnification image of savshrp1 mutant clones (D,D′). GFP is green and BrdU is red. (F) BrdU labelling rates were quantified as the percentage of BrdU-positive cells per MARCM clone (cell autonomy) in savshrp1 mutants compared with neutral clones after 3D confocal imaging of the entire clone and subsequent 3D projection. *P>0.0001. (G) Number of BrdU-positive nuclei within all midgut cells, including clone and non-clone tissue (non-cell autonomy). *P>0.01. Scale bars: 20 μm.
Fig. 5.
Fig. 5.
Hpo pathway inactivation induces Upd expression. (A-A′) upd-lacZ expression is increased in hpo-mutant MARCM clones compared with surrounding midgut tissue. (B-B′) upd-lacZ induction is abolished in hpo,yki double mutant MARCM clones. Nuclei are stained with DAPI (blue), mutant clones are marked by GFP (green) and β-galactosidase is red. (C-C′) Clonal overexpression of Yki leads to increased upd3GFP expression. upd3GFP is green and Yki is red. (D-F′) RT-qPCR and immunofluorescence analysis of adult midguts reveals increased Jak/Stat activity following Yki overexpression in ECs using the 10×StatdGFP reporter (D). StatdGFP is green and PH3 is red. (G) Induction of all three Upd cytokines following MyoIAts-driven expression of Yki measured by RT-qPCR. Scale bars: 20 μm.
Fig. 6.
Fig. 6.
Yki activity is upstream of Jak/Stat signalling in ISCs. (A-H) The esgts-Yki-induced overproliferation and increase in Dl+ cells (B,F) is prevented by co-expression of Stat-RNAi (D,H). Nuclei are stained with DAPI (blue), esg+ cells are marked by GFP (green); PH3 (A-D) and Dl (E-H) are red. (I-P) The MyoIAts-Yki-induced overproliferation and increase in Dl+ cells (J,N) is not rescued by co-expression of Stat-RNAi (L,P). ECs are marked by GFP (green); PH3 (I-L) and Dl (M-P) are red. Quantification of PH3+ cells per midgut. (Q) esgts-driven expression of Stat-RNAi significantly rescues Yki-induced proliferation (P<0.0001, n>20). (R) MyoIAts-driven expression of Stat-RNAi does not rescue Yki-induced proliferation in ECs (n>15). Scale bar: 20 μm.
Fig. 7.
Fig. 7.
Intestinal stress results in increased Yki levels and induction of Hpo pathway targets. (A) RT-qPCR shows Yki target induction (expanded, diap1) immediately upon P.e infection (top panel) and reversal of Yki target mRNA abundance following antibiotic treatment (bottom panel). (B-C′) Increased ex-LacZ activity following 12 hours of P.e infection (C,C′) compared with mock-infected guts (B,B′). Nuclei are stained with DAPI (blue), β-galactosidase is red. (D-E′) Twenty-four hour P.e infection leads to increased Yki levels in esg+ progenitors and ECs (E-E′) compared with mock-infected guts (D,D′). esg+ cells are marked by GFP (green), Yki is red. (F-G′) Increased Yki levels following treatment for 16 hours with paraquat (G,G′) compared with non stressed gut (F,F′). GFP is green and Yki is red. Scale bars: 20 μm.
Fig. 8.
Fig. 8.
Yki is required for the midgut regenerative response to bacterial infection. (A-H) P.e infection induces a proliferative response with increased numbers of esg+ cells, mitoses, Dl+ ISC-like cells and midgut size (A,C,E,G). esgts-driven expression of yki-RNAi (B,F) causes a reduction in the midgut regenerative response to infection (D,H). (I-L) MyoIAts-driven expression of yki-RNAi (J) partially prevents the midgut regenerative response to stress (L). Nuclei are stained with DAPI (blue); esg+ cells (A-H) and ECs (I-L) are marked by GFP (green); PH3 (A-D, I-L) and Dl (E-H) are red. (M,N) Quantification of PH3+ cells upon bacterial infection. esgts-driven expression of a yki-RNAi construct prevents the regenerative response seen in wild-type midguts upon bacterial infection (M) (*P<0.001, n>10). MyoIAts-driven expression of yki-RNAi partially rescues the midgut regenerative response following bacterial infection (N) (**P=0.018, n>14). Scale bar: 20 μm.

References

    1. Agaisse H., Petersen U. M., Boutros M., Mathey-Prevot B., Perrimon N. (2003). Signaling role of hemocytes in Drosophila JAK/STAT-dependent response to septic injury. Dev. Cell 5, 441-450 - PubMed
    1. Amcheslavsky A., Jiang J., Ip Y. (2009). Tissue damage-induced intestinal stem cell division in drosophila. Cell Stem Cell 4, 49-61 - PMC - PubMed
    1. Arbouzova N. I., Zeidler M. P. (2006). JAK/STAT signalling in Drosophila: insights into conserved regulatory and cellular functions. Development 133, 2605-2616 - PubMed
    1. Bach E. A., Ekas L. A., Ayala-Camargo A., Flaherty M. S., Lee H., Perrimon N., Baeg G. H. (2007). GFP reporters detect the activation of the Drosophila JAK/STAT pathway in vivo. Gene Expr. Patterns 7, 323-331 - PubMed
    1. Bando T., Mito T., Maeda Y., Nakamura T., Ito F., Watanabe T., Ohuchi H., Noji S. (2009). Regulation of leg size and shape by the Dachsous/Fat signalling pathway during regeneration. Development 136, 2235-2245 - PubMed

Publication types

MeSH terms

Substances