. 2011 Feb;208(2):171-82.
doi: 10.1677/JOE-10-0338. Epub 2010 Nov 10.

Estrogen receptor agonists and estrogen attenuate TNF-α-induced apoptosis in VSC4.1 motoneurons

Affiliations

Estrogen receptor agonists and estrogen attenuate TNF-α-induced apoptosis in VSC4.1 motoneurons

Arabinda Das et al. J Endocrinol. 2011 Feb.

Abstract

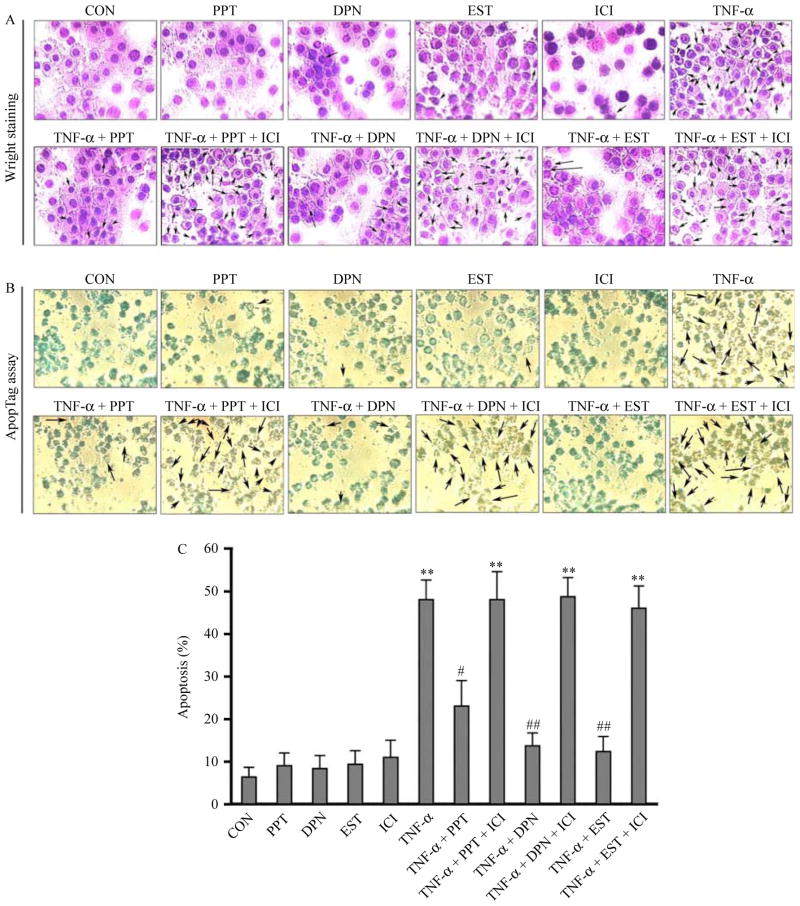
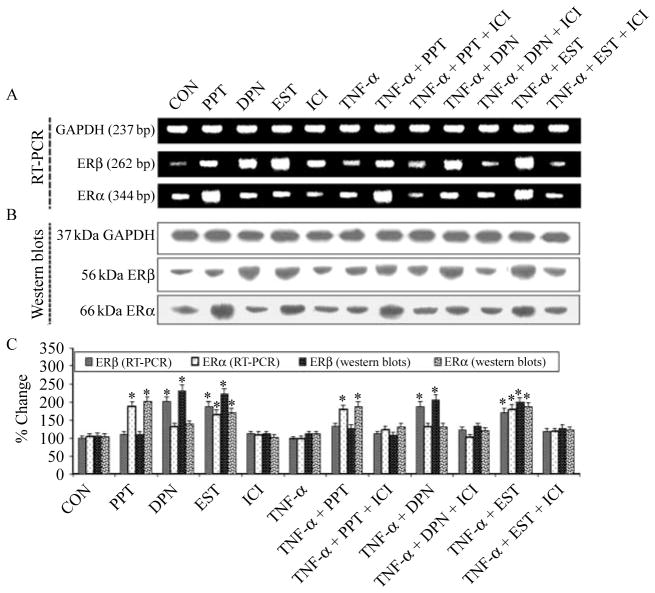
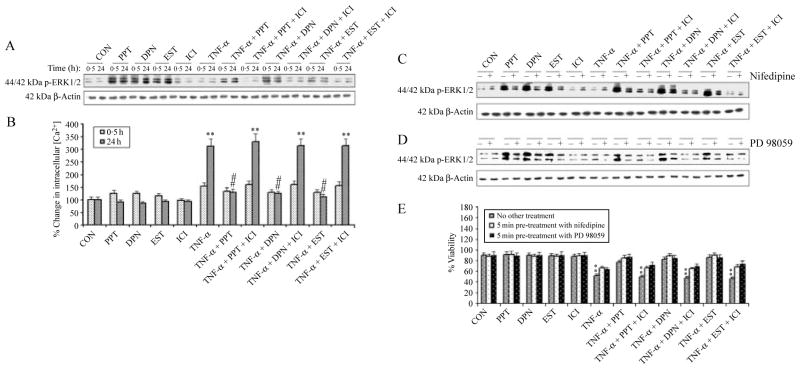
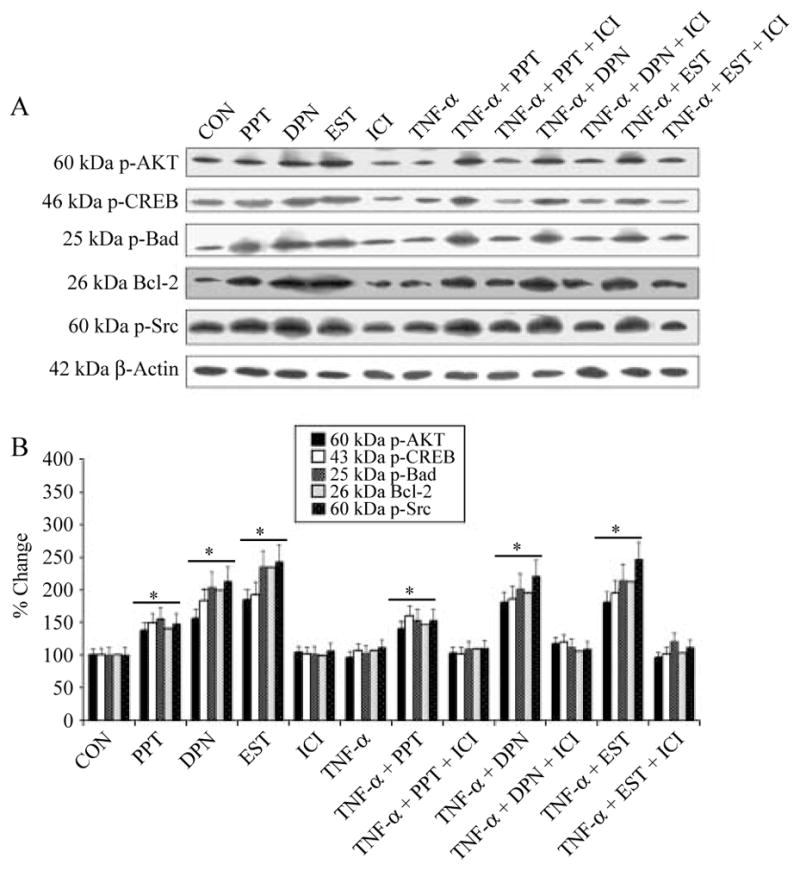
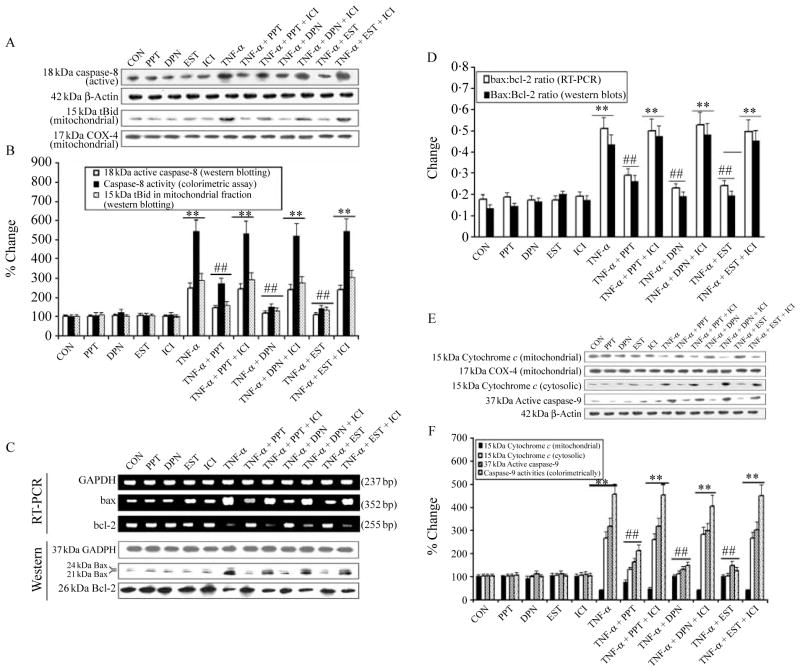
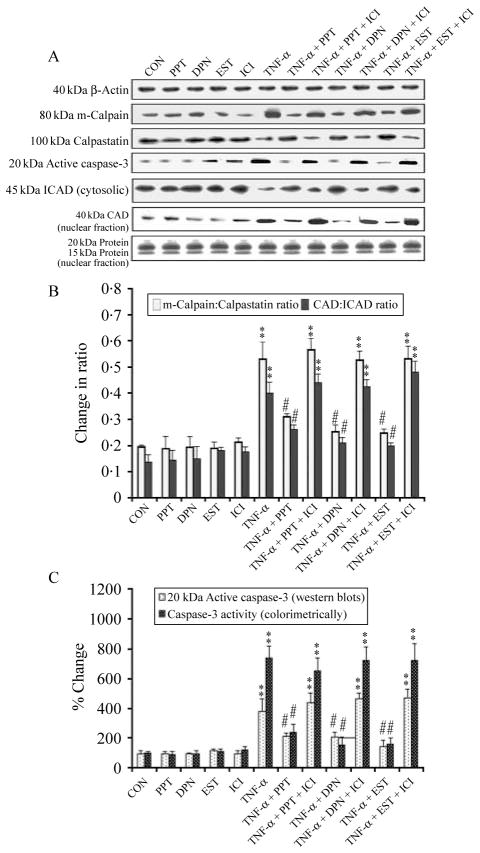
Tumor necrosis factor-alpha (TNF-α) may cause apoptosis and inflammation in amyotrophic lateral sclerosis (ALS) and spinal cord injury (SCI). Recent studies suggest that estrogen (EST) provides neuroprotection against SCI. We tested whether 1,3,5-tris (4-hydroxyphenyl)-4-propyl-1H-pyrazole (PPT) (EST receptor alpha (ERα) agonist), 2,3-bis (4-hydroxyphenyl) propionitrile (DPN) (EST receptor beta (ERβ) agonist), or EST itself would prevent apoptosis in VSC4.1 motoneurons following exposure to TNF-α. Cells were exposed to TNF-α and 15 min later treated with PPT, DPN, or EST. Posttreatment with 50 nM PPT, 50 nM DPN, or 150 nM EST prevented cell death in VSC4.1 motoneurons. Treatment of VSC4.1 motoneurons with PPT, DPN, or EST induced overexpression of ERα, ERβ, or both, which contributed to neuroprotection by upregulating expression of anti-apoptotic proteins (p-AKT, p-CREB, Bcl-2, and p-Src). Our analyses also revealed that EST agonists and EST increased phosphorylation of extracellular signal-regulated kinase (ERK). The L-type Ca(2+) channel inhibitor, nifedipine (10 μM), partially inhibited EST agonist and EST-induced increase in phosphorylated ERK expression. The mitogen-activated protein kinase inhibitor, PD98059 (5 μM), partially prevented ER agonists and EST from providing neuroprotection to TNF-α toxicity. Presence of the nuclear ER antagonist, ICI 182 780 (10 μM), blocked the neuroprotection provided by all three ER agonists tested. Taken together, our data indicate that both ERα and ERβ contribute to PPT, DPN, or EST-mediated neuroprotection with similar signaling profiles. Our data strongly imply that PPT, DPN, or EST can be used as effective neuroprotective agents to attenuate motoneuron death in ALS and SCI.


Conflict of interest statement

Declaration of interest

The authors declare that there is no conflict of interest that may be perceived as prejudicing the impartiality of the research reported.

Figures

Figure 1
Figure 1
Posttreatment with PPT, DPN, or EST prevented TNF-α-induced apoptosis in VSC4.1 motoneurons. Treatment groups: control (CON); 50 nM PPT (24 h); 50 nM DPN (24 h); 150 nM EST (24 h); 10 μM ICI (24 h); 50 ng/ml TNF-α (24 h); 50 ng/ml TNF-α (24 h)+PPT (treatment at 15 min post TNF-α exposure); 50 ng/ml TNF-α (24 h)+PPT (treatment at 15 min post TNF-α exposure)+ICI (treatment at 20 min post TNF-α exposure); 50 ng/ml TNF-α (24 h)+DPN (treatment at 15 min post TNF-α exposure); 50 ng/ml TNF-α (24 h)+DPN (treatment at 15 min post TNF-α exposure)+ICI (treatment at 20 min post TNF-α exposure); 50 ng/ml TNF-α (24 h)+EST (treatment at 15 min post TNF-α exposure); 50 ng/ml TNF-α (24 h)+EST (treatment at 15 min post TNF-α exposure)+ICI (treatment at 20 min post TNF-α exposure). (A) Wright staining showing representative cells from each treatment group. Arrows indicate apoptotic cells. (B) ApopTag assay showing representative cells from each treatment group. (C) Bar graphs indicating the percentage of apoptotic cells counted from each group (based on Wright staining). **P<0·01 compared to control; #P<0·05 compared to TNF-α; ##P<0·01 compared to TNF-α. Full colour version of this figure available via http://dx.doi.org/10.1677/JOE-10-0338.
Figure 2
Figure 2
RT-PCR and western blotting for expression of estrogen receptor beta (ERβ) and estrogen receptor alpha (ERα). Treatment groups: control (CON); 50 nM PPT (24 h); 50 nM DPN (24 h); 150 nM EST (24 h); 10 μM ICI (24 h); 50 ng/ml TNF-α (24 h); 50 ng/ml TNF-α (24 h)+PPT (treatment at 15 min post TNF-α exposure); 50 ng/ml TNF-α (24 h)+PPT (treatment at 15 min post TNF-α exposure)+ICI (treatment at 20 min post TNF-α exposure); 50 ng/ml TNF-α (24 h)+DPN (treatment at 15 min post TNF-α exposure); 50 ng/ml TNF-α (24 h)+DPN (treatment at 15 min post TNF-α exposure)+ICI (treatment at 20 min post TNF-α exposure); 50 ng/ml TNF-α (24 h)+EST (treatment at 15 min post TNF-α exposure); 50 ng/ml TNF-α (24 h)+EST (treatment at 15 min post TNF-α exposure)+ICI (treatment at 20 min post TNF-α exposure). Representative pictures to show levels of ERβ, ERα, and GAPDH at mRNA (RT-PCR) (A) and protein levels (western blotting) (B). (C) Bar graphs indicating the changes in expression of ERβ and ERα over CON. *P<0·05 compared to control.
Figure 3
Figure 3
Determination of ERK phosphorylation, intracellular free [Ca2+], and involvement of L-type Ca2+ channels in VSC4.1 cells. Treatment groups: control (CON); 50 nM PPT (24 h); 50 nM DPN (24 h); 150 nM EST (24 h); 10 μM ICI (24 h); 50 ng/ml TNF-α (24 h); 50 ng/ml TNF-α (24 h)+PPT (treatment at 15 min post TNF-α exposure); 50 ng/ml TNF-α (24 h)+PPT (treatment at 15 min post TNF-α exposure)+ICI (treatment at 20 min post TNF-α exposure); 50 ng/ml TNF-α (24 h)+DPN (treatment at 15 min post TNF-α exposure); 50 ng/ml TNF-α (24 h)+DPN (treatment at 15 min post TNF-α exposure)+ICI (treatment at 20 min post TNF-α exposure); 50 ng/ml TNF-α (24 h)+EST (treatment at 15 min post TNF-α exposure); 50 ng/ml TNF-α (24 h)+EST (treatment at 15 min post TNF-α exposure)+ICI (treatment at 20 min post TNF-α exposure). (A) Posttreatment with PPT, DPN, or EST rapidly increased ERK phosphorylation. Western blot analysis to show levels of phosphorylation of p44/42 ERK1/2 at 0·5 and 24 h. (B) Determination of intracellular free [Ca2+] at 0·5 and 24 h. Western blot analysis to show levels of phosphorylation of p44/42 ERK1/2 after posttreatment with nifedipine (C) and PD98059 (D). (E) Treatment with nifedipine and PD98059 increased cell viability. Trypan blue dye exclusion assay was used to assess cell viability. **P<0·01 compared to control.
Figure 4
Figure 4
Determination of survival proteins. Treatment groups: control (CON); 50 nM PPT (24 h); 50 nM DPN (24 h); 150 nM EST (24 h); 10 μM ICI (24 h); 50 ng/ml TNF-α (24 h); 50 ng/ml TNF-α (24 h)+PPT (treatment at 15 min post TNF-α exposure); 50 ng/ml TNF-α (24 h)+PPT (treatment at 15 min post TNF-α exposure)+ICI (treatment at 20 min post TNF-α exposure); 50 ng/ml TNF-α (24 h)+DPN (treatment at 15 min post TNF-α exposure); 50 ng/ml TNF-α (24 h)+DPN (treatment at 15 min post TNF-α exposure)+ICI (treatment at 20 min post TNF-α exposure); 50 ng/ml TNF-α (24 h)+EST (treatment at 15 min post TNF-α exposure); 50 ng/ml TNF-α (24 h)+EST (treatment at 15 min post TNF-α exposure)+ICI (treatment at 20 min post TNF-α exposure). (A) Western blotting to show levels of p-AKT, p-CREB, p-Bad, Bcl-2, p-Src, and β-actin. (B) Densitometric analysis showing percent change in OD of the p-AKT, p-CREB, p-Bad, Bcl-2, and p-Src bands. *P<0·05 compared to control.
Figure 5
Figure 5
Examination of components involved in extrinsic and intrinsic apoptotic pathways. Treatment groups: control (CON); 50 nM PPT (24 h); 50 nM DPN (24 h); 150 nM EST (24 h); 10 μM ICI (24 h); 50 ng/ml TNF-α (24 h); 50 ng/ml TNF-α (24 h)+PPT (treatment at 15 min post TNF-α exposure); 50 ng/ml TNF-α (24 h)+PPT (treatment at 15 min post TNF-α exposure)+ICI (treatment at 20 min post TNF-α exposure); 50 ng/ml TNF-α (24 h)+DPN (treatment at 15 min post TNF-α exposure); 50 ng/ml TNF-α (24 h)+DPN (treatment at 15 min post TNF-α exposure)+ICI (treatment at 20 min post TNF-α exposure); 50 ng/ml TNF-α (24 h)+EST (treatment at 15 min post TNF-α exposure); 50 ng/ml TNF-α (24 h)+EST (treatment at 15 min post TNF-α exposure)+ICI (treatment at 20 min post TNF-α exposure). (A) Western blotting to show levels of caspase-8, β-actin, tBid, and COX4. (B) Densitometric analysis showing percent change in OD of the caspase-8 and tBid bands and determination of caspase-8 activity (colorimetrically). (C) Alteration in Bax and Bcl-2 expression at mRNA and protein levels. Representative pictures to show Bax, Bcl-2, and GAPDH at mRNA (RT-PCR) and protein (western blotting) levels after different treatments. (D) Densitometric analysis showing the Bax:Bcl-2 ratio. (E) Western blotting to show levels of cytochrome c, COX4, caspase-9, and β-actin. (F) Densitometric analysis showing percent change in OD of the mitochondrial and cytosolic 15 kDa cytochrome c and 39 kDa active caspase-9, and determination of caspase-9 activity (colorimetrically). **P<0·01 compared to control; ##P<0·01 compared to TNF-α.
Figure 6
Figure 6
Examination of downstream events of apoptosis in VSC4.1 cells. Treatment groups: control (CON); 50 nM PPT (24 h); 50 nM DPN (24 h); 150 nM EST (24 h); 10 μM ICI (24 h); 50 ng/ml TNF-α (24 h); 50 ng/ml TNF-α (24 h)+PPT (treatment at 15 min post TNF-α exposure); 50 ng/ml TNF-α (24 h)+PPT (treatment at 15 min post TNF-α exposure)+ICI (treatment at 20 min post TNF-α exposure); 50 ng/ml TNF-α (24 h)+DPN (treatment at 15 min post TNF-α exposure); 50 ng/ml TNF-α (24 h)+DPN (treatment at 15 min post TNF-α exposure)+ICI (treatment at 20 min post TNF-α exposure); 50 ng/ml TNF-α (24 h)+EST (treatment at 15 min post TNF-α exposure); 50 ng/ml TNF-α (24 h)+EST (treatment at 15 min post TNF-α exposure)+ICI (treatment at 20 min post TNF-α exposure). (A) Western blotting to show levels of m-calpain, calpastatin, active caspase-3, ICAD (cytosolic), CAD (nuclear), and β-actin. (B) Densitometric analysis showing the m-calpain:calpastatin ratio and the ICAD (cytosolic):CAD (nuclear) ratio. (C) Determination of caspase-3 activation by western blotting and total caspase-3 activity by colorimetric assay. **P<0·01 compared to control; ##P<0·01 compared to TNF-α.

References

    1. Behl C, Skutella T, Lezoualc’h F, Post A, Widmann M, Newton CJ, Holsboer F. Neuroprotection against oxidative stress by estrogens: structure–activity relationship. Molecular Pharmacology. 1997;51:535–541. - PubMed
    1. Cordey M, Pike CJ. Neuroprotective properties of selective estrogen receptor agonists in cultured neurons. Brain Research. 2005;1045:217–223. doi: 10.1016/j.brainres.2005.03.032. - DOI - PubMed
    1. Crawford GD, Le WD, Smith RG, Xie WJ, Appel SH. A novel N18TG2×mesencephalon cell hybrid expresses properties that suggest a dopaminergic cell line of substantia nigra origin. Journal of Neuroscience. 1992;12:3392–3398. - PMC - PubMed
    1. Das A, Sribnick EA, Wingrave JM, Del Re AM, Woodward JJ, Appel SH, Banik NL, Ray SK. Calpain activation in apoptosis of ventral spinal cord 4.1 (VSC4.1) motoneurons exposed to glutamate: calpain inhibition provides functional neuroprotection. Journal of Neuroscience Research. 2005;81:551–562. doi: 10.1002/jnr.20581. - DOI - PubMed
    1. Das A, McDowell M, Pava MJ, Smith JA, Reiter RJ, Woodward JJ, Varma AK, Ray SK, Banik NL. The inhibition of apoptosis by melatonin in VSC4.1 motoneurons exposed to oxidative stress, glutamate excitotoxicity, or TNF-alpha toxicity involves membrane melatonin receptors. Journal of Pineal Research. 2010a;48:157–169. doi: 10.1111/j.1600-079X.2009.00739.x. - DOI - PMC - PubMed

Publication types

MeSH terms