Review
. 2011 Feb;300(2):F291-300.
doi: 10.1152/ajprenal.00082.2010. Epub 2010 Nov 10.

Transgenic mice: beyond the knockout

Affiliations
Review

Transgenic mice: beyond the knockout

R Lance Miller. Am J Physiol Renal Physiol. 2011 Feb.

Abstract

Transgenic mice have had a tremendous impact on biomedical research. Most researchers are familiar with transgenic mice that carry Cre recombinase (Cre) and how they are used to create conditional knockouts. However, some researchers are less familiar with many of the other types of transgenic mice and their applications. For example, transgenic mice can be used to study biochemical and molecular pathways in primary cultures and cell suspensions derived from transgenic mice, cell-cell interactions using multiple fluorescent proteins in the same mouse, and the cell cycle in real time and in the whole animal, and they can be used to perform deep tissue imaging in the whole animal, follow cell lineage during development and disease, and isolate large quantities of a pure cell type directly from organs. These novel transgenic mice and their applications provide the means for studying of molecular and biochemical events in the whole animal that was previously limited to cell cultures. In conclusion, transgenic mice are not just for generating knockouts.


Figures

Fig. 1.
Fig. 1.
Schematic of nonhomologous recombination. A: a basic transgene. B: pronuclear injection of a fertilized mouse oocyte. Typical transgene consists of a cell-specific promoter placed upstream of the cDNA followed by a 3′-untranslated region [3′-UTR (polyadenylation signal)]. The promoter drives expression of the cDNA in a cell-specific manner, while the 3′-UTR promotes efficient translation of the cDNA. Unique restriction enzymes (linearized) are used to remove the transgene from the plasmid vector, and the transgene is placed in a micropipette and injected into the pronucleus of a fertilized mouse oocyte.
Fig. 2.
Fig. 2.
Schematic of homologous recombination: target locus and targeting construct (A), embryonic stem (ES) cells and feeder cells (B), and ES cell injection into mouse blastocyte (C). Targeting construct consists of arms of homology (ARM-H), loxP sites flanking exon 2 and neomycin (Neo) resistance gene, and the thymidine kinase (tk). Arms of homology consist of ∼2,000- to 5,000-bp sequences that flank the target locus; this is the critical step for homologous recombination. The loxP sites flank exon 2 and the Neo resistance gene, which will be removed later following Cre-loxP-mediated excision. The Neo resistance gene is removed by Cre-loxP excision in the ES cells, because it has been shown that Neo can cause adverse effects in the whole animal. The thymidine kinase gene is placed outside the arms of homology for selection against nonhomologous recombination. The targeting construct is electroporated into mouse ES cells, plated onto a “lawn” of feeder cells, and grown in the presence of gentamicin. Only those cells where recombination has occurred will grow. Cells are also grown in the presence of ganciclovir to select against nonhomologous recombination. If nonhomologous recombination occurs, the thymidine kinase-selectable marker is expressed and produces a toxin in the presence of ganciclovir, thereby killing all those cells. ES cells that are positive for homologous recombination are then expanded and injected into the mouse blastocyte.
Fig. 3.
Fig. 3.
Summary of fluorescent protein peak excitation and emissions. A: range of peak emission frequencies for enhanced green fluorescent protein (EGFP)-derived (green) and pH- and Ca2+-sensitive (blue) dyes and mouse red fluorescent protein (mRFP)-derived (red) fluorescent proteins. B: peak excitation and emission frequencies for select fluorescent proteins and pH- and Ca2+-sensitive dyes. EBFP, ECFP, and EYFP, enhanced blue, cyan, and yellow fluorescent proteins.
Fig. 4.
Fig. 4.
Deep tissue imaging. Excitation (ex) and emission (em) wavelengths are required to penetrate the skin, red blood cells (RBC), and cells expressing the fluorescent protein. A: excitation and emission wavelengths at or near 600 nm are likely to be absorbed by hemoglobin (heme) within RBC and, thus, do not reach cells that express the fluorescent protein. B: excitation and emission wavelengths >600 nm are not absorbed by RBCs and are able to reach cells expressing the fluorescent protein Neptune.
Fig. 5.
Fig. 5.
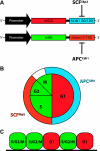
Monitoring cell cycle progression in real time. A: transgenes used to monitor cell cycle progression. The mKO2 fluorescent protein (red) was fused to a mutated human chromatin licensing and DNA replication factor 1 (hCdt1), which is expressed during the G1 phase of the cell cycle. The mAG fluorescent protein (green) was fused to a mutated human Germin (hGem), which is expressed during the S/G2/M phase of the cell cycle. SCFSkp2 and APCCdh1 are E3 ligases that are expressed during the S/G2 phase and late M and G1 phases, respectively. SCFSkp2 and APCCdh1 target hCdt1 and hGem for degradation, respectively. B: schematic representation of the cell cycle. Inner circle represents cell cycle phases, and corresponding colors show expression of the fluorescent proteins mKO2 (red) and mAG (green). Outer circle shows expression of SCFSkp2 and APCCdh1. C: cells expressing these two transgenes; i.e., green cells are in the S/G2/M phase and red cells are in the G1 phase of the cell cycle.
Fig. 6.
Fig. 6.
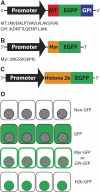
Green fluorescent protein (GFP) labeling of subcellular structures. A–C: schematic overview of the transgenes glycosylphosphatidylinositol (GPI)-EGFP, myristoyl (Myr)-EGFP, and histone 2b (H2b)-EGFP transgene. For the GPI-EGFP construct, the NH2-terminal membrane translocation signal sequence from acrosin (MT) was added to the GFP NH2 terminus, and the COOH-terminal sequence from the Thy-1 NH2-terminal GPI-linked signal sequence was added to the GFP COOH terminus. For the Myr-EGFP construct, the NH2-terminal myristoylation tag from Src was added to the GFP NH2 terminus. The H2b-GFP construct was generated by fusion of the pEGFP sequence to the H2b sequence. D: cells expressing non-GFP, GFP, Myr-GFP or GPI-GFP, and H2b-GFP and corresponding localization of GFP. GFP is expressed throughout the cytoplasm in GFP-expressing cells, in the lipid membranes (plasma and nuclear) in the Myr-GFP- and GPI-GFP-expressing cells, and in the nucleus in the H2b-GFP-expressing cells.
Fig. 7.
Fig. 7.
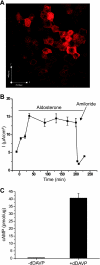
Primary cultures and tubular suspensions from complex object parameter analyzer sorter (COPAS)-isolated connecting segment (CNT)/cortical collecting duct (CCD). A: typical fluorescence confocal micrograph of primary cultures from COPAS-isolated CNT/CCD following exposure to 10−8 DDAVP for 72 h; cells demonstrated strong expression of aquaporin 2 [AQP2 (red)]. B: typical open-circuit current recording from primary cultures from COPAS-isolated CNT/CCD following exposure to 1 μM aldosterone for 4 h and then 10 μM amiloride. C: vasopressin-dependent cAMP production in COPAS-isolated CNT/CCD (200 tubules/sample). CNT/CCD were isolated and incubated at 37°C for 2 h, at which time cAMP levels were measured following 30 min of exposure to 10−8 dDAVP and 400 μM IBMX. (From L. Miller, D. Kohan, K. Strait, and R. Nelson, unpublished data).
Fig. 8.
Fig. 8.
Spatiotemporal profiling of actively translated mRNA. A: schematic of EGFP-L10a ribosome fusion transgene. B: EGFP-L10a ribosomal-expressing and -nonexpressing cells. C: EGFP-L10a ribosome-mRNA complex and native ribosome-mRNA complex. D: selective isolation of EGFP-L10a ribosome-mRNA complex using magnetic beads labeled with anti-EGFP antibodies.
Fig. 9.
Fig. 9.
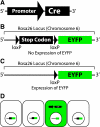
Cre/loxP system for cell lineage and fate. A–C: schematic of generic Cre transgene, Rosa26-loxP-stop codon-loxP-EYFP targeted allele with an intact stop codon, and Rosa26-lox-EYFP targeted allele following Cre-mediated excision of the stop codon (C). D: schematic of progenitor cells. All cells possess the Rosa26-lox-EYFP targeted allele, but only those cells that express Cre are green and will remain green over the course of development, differentiation, or dedifferentiation.
Fig. 10.
Fig. 10.
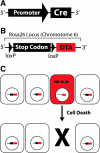
Conditional cell death/ablation. A and B: schematic of generic Cre transgene and Rosa26-loxP-stop codon-loxP-diphtheria toxin A-chain (DTA) targeted allele. C: schematic of cells. All cells possess the Rosa26-lox-DTA targeted allele (red), but only those cells that express Cre (red) will express DTA and are targeted for cell death/ablation. Rosa26-lox-DTA allele is represented in red for effect; it is not and should not be considered a fluorescent protein. Thymidine kinase and chemical inducer of dimerization transgenes are not shown. However, they are expressed, and their function is similar to that of DTA; i.e., only those cells expressing these “deleter” genes in conjunction with Cre are targeted for cell death. Similarly, DTA, thymidine kinase, and chemical inducer of dimerization transgenes can be expressed by targeting them to the Rosa26 locus (as shown here) or using a cell-specific promoter.

Similar articles

Cited by

References

    1. Alexander GM, Rogan SC, Abbas AI, Armbruster BN, Pei Y, Allen JA, Nonneman RJ, Hartmann J, Moy SS, Nicolelis MA, McNamara JO, Roth BL. Remote control of neuronal activity in transgenic mice expressing evolved G protein-coupled receptors. Neuron 63: 27–39, 2009 - PMC - PubMed
    1. Amoh Y, Katsuoka K, Hoffman RM. Color-coded fluorescent protein imaging of angiogenesis: the AngioMouse models. Curr Pharm Des 14: 3810–3819, 2008 - PubMed
    1. Apostolov K, Barker W. Reversible increase in the saturation of C18 fatty acids induced by diphtheria toxin in tissue culture cells. Infect Immun 38: 843–847, 1982 - PMC - PubMed
    1. Armbruster BN, Li X, Pausch MH, Herlitze S, Roth BL. Evolving the lock to fit the key to create a family of G protein-coupled receptors potently activated by an inert ligand. Proc Natl Acad Sci USA 104: 5163–5168, 2007 - PMC - PubMed
    1. Armstrong JJ, Larina IV, Dickinson ME, Zimmer WE, Hirschi KK. Characterization of bacterial artificial chromosome transgenic mice expressing mCherry fluorescent protein substituted for the murine smooth muscle α-actin gene. Genesis 48: 457–463, 2010 - PMC - PubMed

LinkOut - more resources