

A mathematical model of the urine concentrating mechanism in the rat renal medulla. II. Functional implications of three-dimensional architecture
- PMID: 21068088
- PMCID: PMC3043998
- DOI: 10.1152/ajprenal.00204.2010
A mathematical model of the urine concentrating mechanism in the rat renal medulla. II. Functional implications of three-dimensional architecture
Abstract
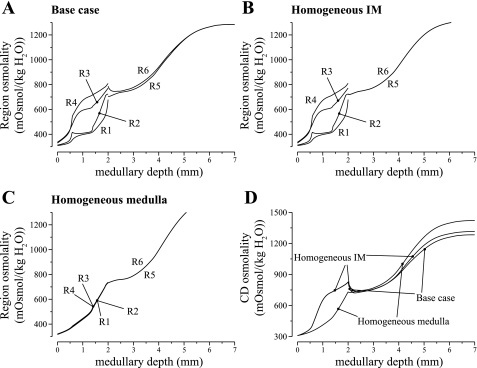
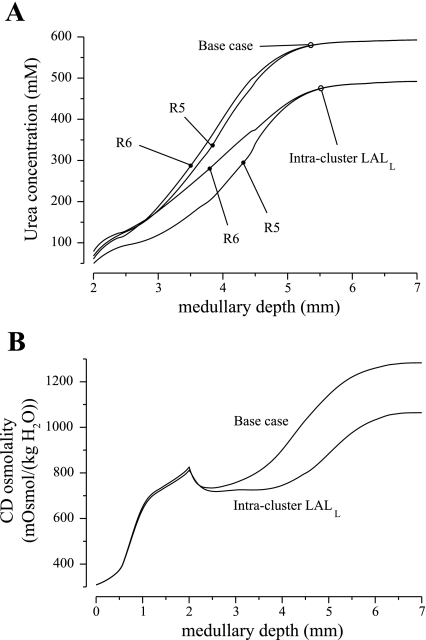
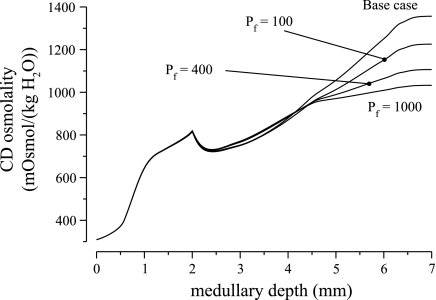
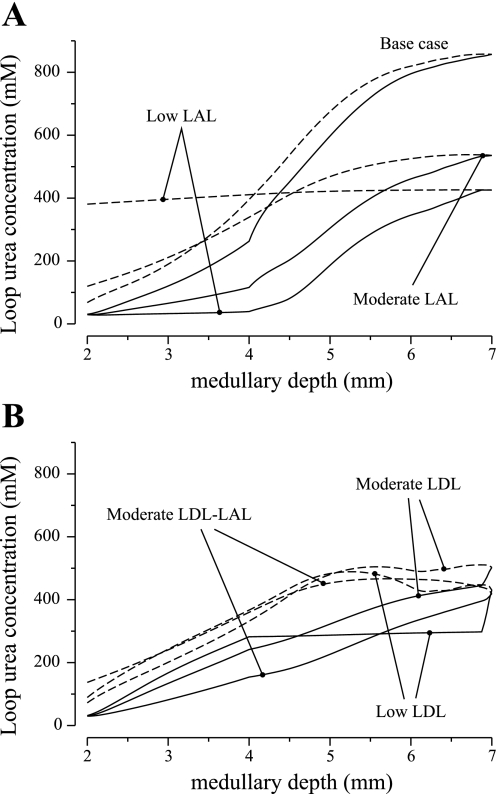
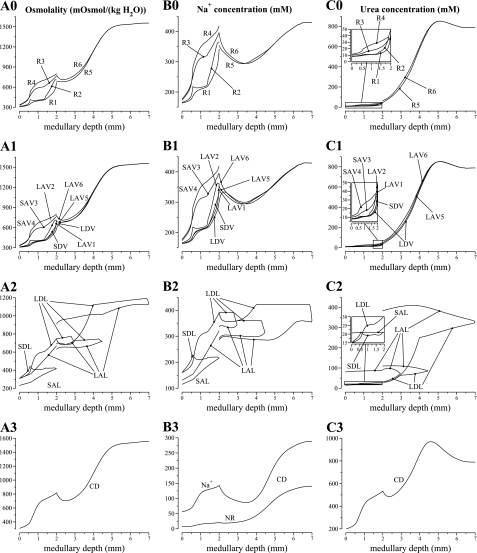
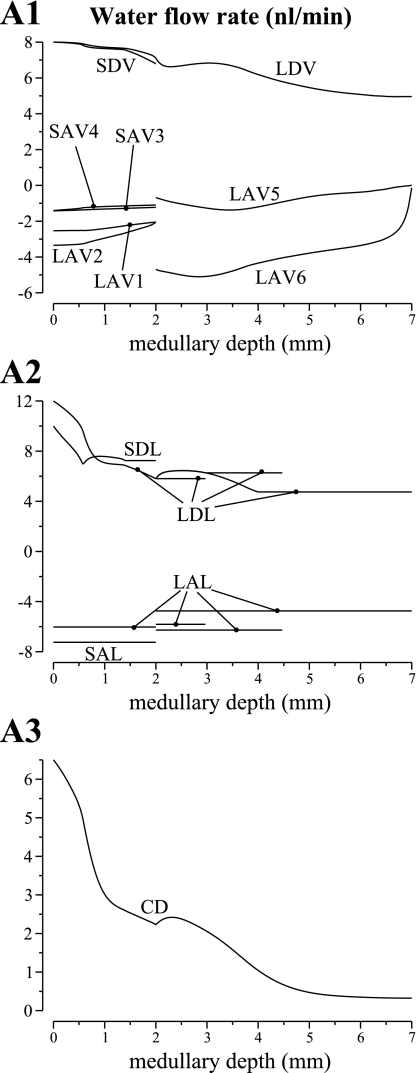
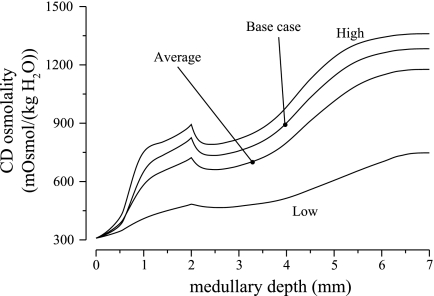
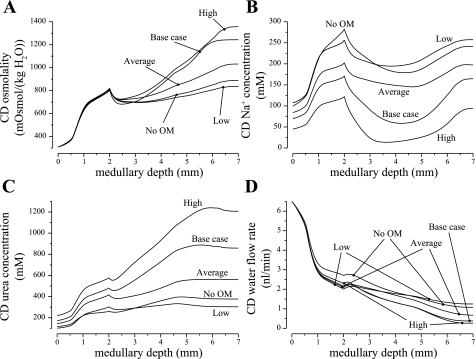
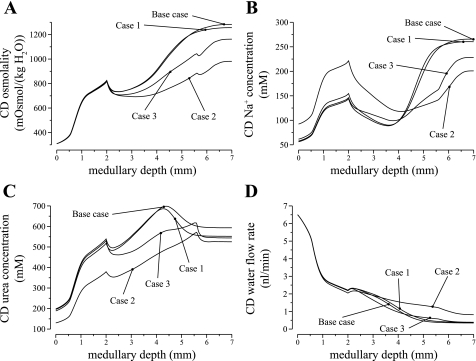
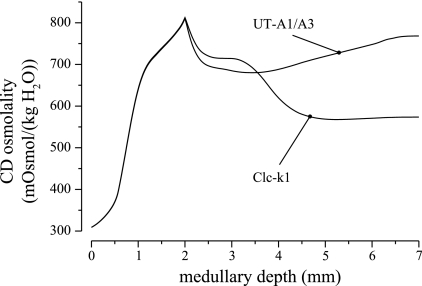
In a companion study [Layton AT. A mathematical model of the urine concentrating mechanism in the rat renal medulla. I. Formulation and base-case results. Am J Physiol Renal Physiol. (First published November 10, 2010). 10.1152/ajprenal.00203.2010] a region-based mathematical model was formulated for the urine concentrating mechanism in the renal medulla of the rat kidney. In the present study, we investigated model sensitivity to some of the fundamental structural assumptions. An unexpected finding is that the concentrating capability of this region-based model falls short of the capability of models that have radially homogeneous interstitial fluid at each level of only the inner medulla (IM) or of both the outer medulla and IM, but are otherwise analogous to the region-based model. Nonetheless, model results reveal the functional significance of several aspects of tubular segmentation and heterogeneity: 1) the exclusion of ascending thin limbs that reach into the deep IM from the collecting duct clusters in the upper IM promotes urea cycling within the IM; 2) the high urea permeability of the lower IM thin limb segments allows their tubular fluid urea content to equilibrate with the surrounding interstitium; 3) the aquaporin-1-null terminal descending limb segments prevent water entry and maintain the transepithelial NaCl concentration gradient; 4) a higher thick ascending limb Na(+) active transport rate in the inner stripe augments concentrating capability without a corresponding increase in energy expenditure for transport; 5) active Na(+) reabsorption from the collecting duct elevates its tubular fluid urea concentration. Model calculations predict that these aspects of tubular segmentation and heterogeneity promote effective urine concentrating functions.
Figures
Similar articles
-
A region-based mathematical model of the urine concentrating mechanism in the rat outer medulla. II. Parameter sensitivity and tubular inhomogeneity.Am J Physiol Renal Physiol. 2005 Dec;289(6):F1367-81. doi: 10.1152/ajprenal.00347.2003. Epub 2005 May 24. Am J Physiol Renal Physiol. 2005. PMID: 15914775
-
A mathematical model of the urine concentrating mechanism in the rat renal medulla. I. Formulation and base-case results.Am J Physiol Renal Physiol. 2011 Feb;300(2):F356-71. doi: 10.1152/ajprenal.00203.2010. Epub 2010 Nov 10. Am J Physiol Renal Physiol. 2011. PMID: 21068086 Free PMC article.
-
Functional implications of the three-dimensional architecture of the rat renal inner medulla.Am J Physiol Renal Physiol. 2010 Apr;298(4):F973-87. doi: 10.1152/ajprenal.00249.2009. Epub 2010 Jan 6. Am J Physiol Renal Physiol. 2010. PMID: 20053796 Free PMC article.
-
Role of three-dimensional architecture in the urine concentrating mechanism of the rat renal inner medulla.Am J Physiol Renal Physiol. 2008 Nov;295(5):F1271-85. doi: 10.1152/ajprenal.90252.2008. Epub 2008 May 21. Am J Physiol Renal Physiol. 2008. PMID: 18495796 Free PMC article. Review.
-
Mechanisms to concentrate the urine: an opinion.Curr Opin Nephrol Hypertens. 2008 Jul;17(4):416-22. doi: 10.1097/MNH.0b013e328304b3f5. Curr Opin Nephrol Hypertens. 2008. PMID: 18660679 Review.
Cited by
-
A mathematical model of the rat nephron: glucose transport.Am J Physiol Renal Physiol. 2015 May 15;308(10):F1098-118. doi: 10.1152/ajprenal.00505.2014. Epub 2015 Feb 18. Am J Physiol Renal Physiol. 2015. PMID: 25694480 Free PMC article.
-
Oxygen transport in a cross section of the rat inner medulla: impact of heterogeneous distribution of nephrons and vessels.Math Biosci. 2014 Dec;258:68-76. doi: 10.1016/j.mbs.2014.09.009. Epub 2014 Sep 28. Math Biosci. 2014. PMID: 25260928 Free PMC article.
-
Architecture of kangaroo rat inner medulla: segmentation of descending thin limb of Henle's loop.Am J Physiol Regul Integr Comp Physiol. 2012 Mar 15;302(6):R720-6. doi: 10.1152/ajpregu.00549.2011. Epub 2012 Jan 11. Am J Physiol Regul Integr Comp Physiol. 2012. PMID: 22237592 Free PMC article.
-
Urine-concentrating mechanism in the inner medulla: function of the thin limbs of the loops of Henle.Clin J Am Soc Nephrol. 2014 Oct 7;9(10):1781-9. doi: 10.2215/CJN.08750812. Epub 2013 Aug 1. Clin J Am Soc Nephrol. 2014. PMID: 23908457 Free PMC article.
-
Effects of the environment on the evolution of the vertebrate urinary tract.Nat Rev Urol. 2023 Dec;20(12):719-738. doi: 10.1038/s41585-023-00794-3. Epub 2023 Jul 13. Nat Rev Urol. 2023. PMID: 37443264 Review.
References
-
- Bankir L, Bouby N, Trinh-Trang-Tan MM. Heterogeneity of nephron anatomy.Kidney Int31, Suppl 20:S-25–S-39, 1987 - PubMed
-
- Bankir L, de Rouffignac C. Urinary concentrating ability: insights from comparative anatomy.Am J Physiol Regul Integr Comp Physiol 249:R643–R666, 1985 - PubMed
-
- Chen J, Layton AT, Edwards A. A mathematical model of oxygen transport in the rat outer medulla. I. Model formulation and baseline results.Am J Physiol Renal Physiol 297:F517–F536, 2009 - PMC - PubMed
-
- Chou CL, Knepper MA. In vitro perfusion of chinchilla thin limb segments: urea and NaCl permeabilities.Am J Physiol Renal Fluid Electrolyte Physiol 264:F337–F343, 1993 - PubMed
Publication types
MeSH terms
Substances
Grants and funding
LinkOut - more resources
Full Text Sources