. 2011 Jun;21(6):1351-61.
doi: 10.1093/cercor/bhq214. Epub 2010 Nov 10.

Development of inhibitory timescales in auditory cortex

Affiliations

Development of inhibitory timescales in auditory cortex

Anne-Marie M Oswald et al. Cereb Cortex. 2011 Jun.

Abstract

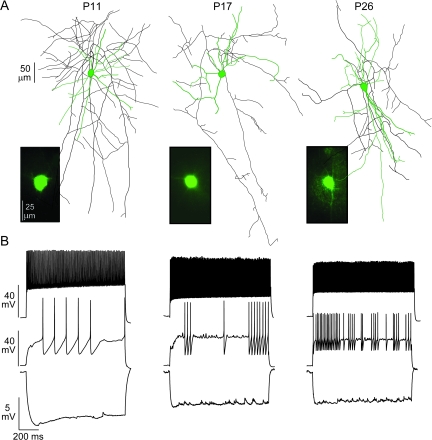
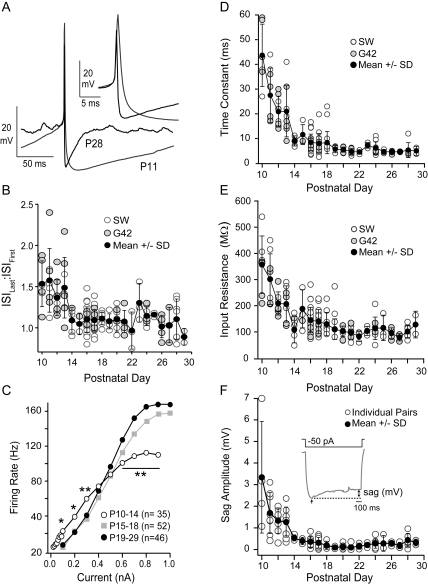
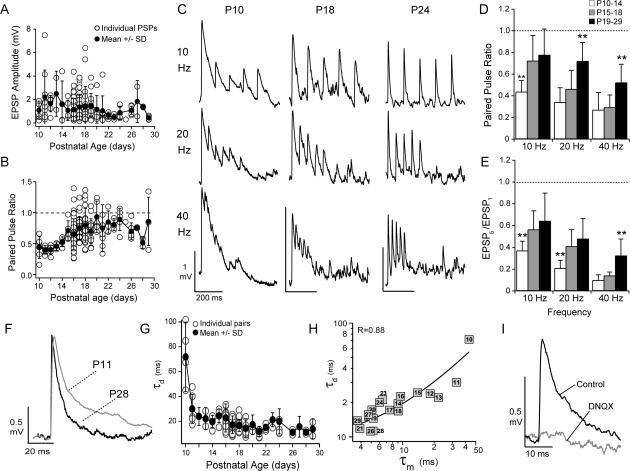
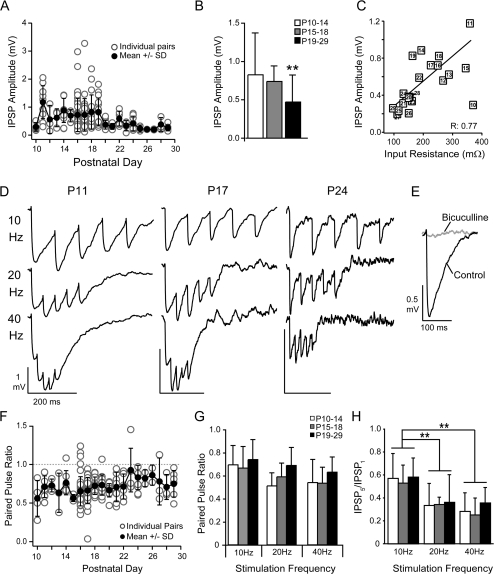
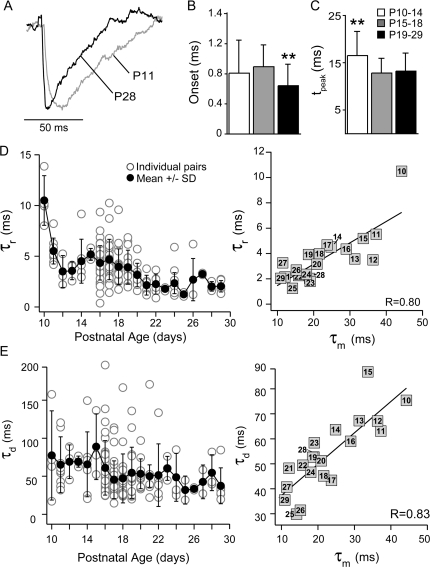
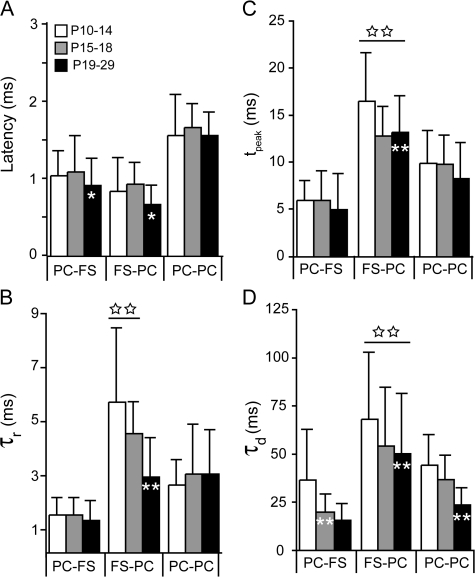
The time course of inhibition plays an important role in cortical sensitivity, tuning, and temporal response properties. We investigated the development of L2/3 inhibitory circuitry between fast-spiking (FS) interneurons and pyramidal cells (PCs) in auditory thalamocortical slices from mice between postnatal day 10 (P10) and P29. We found that the maturation of the intrinsic and synaptic properties of both FS cells and their connected PCs influence the timescales of inhibition. FS cell firing rates increased with age owing to decreased membrane time constants, shorter afterhyperpolarizations, and narrower action potentials. Between FS-PC pairs, excitatory postsynaptic potentials (EPSPs) and inhibitory postsynaptic potentials (IPSPs) changed with age. The latencies, rise, and peak times of the IPSPs, as well as the decay constants of both EPSPs and IPSPs decreased between P10 and P29. In addition, decreases in short-term depression at excitatory PC-FS synapses resulted in more sustained synaptic responses during repetitive stimulation. Finally, we show that during early development, the temporal properties that influence the recruitment of inhibition lag those of excitation. Taken together, our results suggest that the changes in the timescales of inhibitory recruitment coincide with the development of the tuning and temporal response properties of auditory cortical networks.


Figures

Figure 1.
Figure 1.
Development of FS characteristics. (A) Representative GFP+ (insets) FS cells recorded in G42 mice at P11, P17, and P26. The neurons were also filled with biocytin for reconstruction of dendritic (green) and axonal arbors (black). (B) The responses of the corresponding neurons in (A) to hyperpolarizing (−0.05 nA, lower), near rheobase (0.1–0.5 nA, middle) and strongly depolarizing (0.5–1.0 nA, upper) current step injections.
Figure 2.
Figure 2.
Development of intrinsic membrane properties. (A) Single-action potentials recorded at P11 (gray) and P28 (black) aligned at threshold (arrow) to show the age-dependent differences in spike properties. The spike width (inset) and duration of the AHP decrease significantly with age. (B) The adaptation ratio (ISILast:ISIFirst, mean ± SD, black circles) decreases significantly with age in G42 (gray circles) and SW (open circles). (C) The average firing rate (hertz) versus injected current for FS cells recorded at P10–P14 (white circles), P15–P18 (gray squares), and P19–P29 (black circles). The firing rates for low (0.1–0.3 nA), and high (0.6–0.9 nA) input currents in P10–P14 neurons differed significantly from older animals (*P < 0.05; **P < 0.01). (D) Membrane time constants of FS cells versus postnatal day age in SW mice (open circles) and G42 mice (gray circles). The mean ± SD (black circles) over all neurons for each day is also plotted. (E) The input resistances of FS cells versus postnatal day age (symbols as in D). The membrane time constants and input resistances did not differ between strains of mice (see Supplementary Table 1 for comparison of SW and G42 strains). Over all neurons, the time constants and input resistances decreased significantly with age (see Table 1). (F) The amplitude of sag versus postnatal day age. Inset: the sag response to a 1-s −50 pA step current injection at P11. The amplitude of the sag (millivolt) was the difference (double-headed arrow) between the average steady state hyperpolarization during the last 100 ms of the step and the maximum hyperpolarization (single-headed arrow) at the onset of the step. In all plots, the error bars are SD.
Figure 3.
Figure 3.
Properties of excitatory synaptic potentials to FS cells. (A) The mean ± SD (black circles) EPSP amplitude decreased with postnatal day age in PC to FS pairs (open circles). (B) The paired pulse ratio (10-Hz stimulation) increases with postnatal day age (symbols as in A). (C) Sample traces in response to 10-, 20-, and 40-Hz stimulation of the presynaptic PC at P10, P18, and P24. (D) The average paired pulse ratios for 10-, 20-, and 40-Hz stimulation over the 3 age groups P10–P14 (white bars), P15–P18 (gray bars), and P19–P29 (black bars). The P10–P14 neurons showed the significantly stronger paired pulse depression at 10 Hz (white bars, **P < 0.01) compared with the other age groups. The P19–P29 neurons showed the least depression (black bars, **P < 0.01) at higher stimulus frequencies (20 and 40 Hz). (E) The ratio of the amplitude of the fifth EPSP in the train to the first EPSP in the trains for the 3 age groups. For 10- and 20-Hz stimulation, P10–P14 neurons (white bars) showed the most depression while P19–P29 neurons showed the least depression at 40 Hz (black bars, **P < 0.01). (F) Representative EPSPs recorded at P11 (gray) and P28 (black). (G) EPSP amplitudes were normalized to 1 and the EPSPs were fit by a difference of 2 exponentials to obtain time constants for the rise (τr) and decay (τd). The τd decreased with postnatal day age (open circles). Filled circles are the mean ± SD for each age. (H) The mean τd was positively correlated with membrane time constant (τm) for each postnatal day (denoted by numbered boxes) (R: 0.88, linear fit, black line). (I) The EPSPs (black) were completely blocked by the AMPA receptor antagonist DNQX (20 μM, gray, n = 8) at resting membrane potentials (−65 to −75 mV).
Figure 4.
Figure 4.
Developmental changes in inhibitory synaptic potentials. (A) The mean ± SD (black circles) IPSP amplitudes decrease with postnatal day age. Open circles are amplitudes for individual pairs. (B) The average IPSP amplitudes for the 3 age groups (P10–P14, P15–P18, and P19–P29). The IPSP amplitudes significantly decreased at P19–P29 versus P10–P14 (**P < 0.01). (C) IPSP amplitudes were correlated (R: 0.77) with changes in input resistance in the postsynaptic PCs (number in symbol indicates postnatal day). (D) Sample traces in response to 10-, 20-, and 40-Hz stimulation of the presynaptic FS cell at P11, P17, and P24. (E) The inhibitory response was completely blocked by 10 μM bicuculline. (F) The paired pulse ratio (10 Hz) did not change with postnatal day (symbols as in A). (G) The average paired pulse ratios for 10-, 20-, and 40-Hz stimulation over the 3 age groups P10–P14 (white bars), P15–P18 (gray bars), and P19–29 (black bars). (H) The ratio of the amplitude of the fifth IPSP in the train to the first EPSP in the trains for the 3 age groups. There was significant depression of the fifth pulse at higher frequencies (**P < 0.01) but this was independent of age.
Figure 5.
Figure 5.
Temporal properties of IPSPs. (A) Representative IPSPs recorded at P11 (gray) and P28 (black). (B) The IPSP onset latencies were significantly shorter at P19–P29 (black bars) than at P10–P14 (white bars) or P15–P18 (gray bars) (**P < 0.01). (C) The time from the IPSP onset to peak was significantly longer in P10–P14 animals (**P < 0.01). IPSP amplitudes were normalized to 1 and the IPSPs were fit by a difference of 2 exponentials to obtain time constants for the rise (τr) and decay (τd). (D) Left: The τr decreased with postnatal day age (mean ± SD, black circles; individual pairs, white circles). Right: The mean τr was positively correlated with the membrane time constant (τm) of the postsynaptic PC for each postnatal day (R: 0.80, black line). (E) Left: The τd decreased with postnatal day age (symbols as in D) Right: The mean τd was positively correlated with the τm of the postsynaptic PC for each postnatal day (R: 0.83, black line).
Figure 6.
Figure 6.
Comparison of temporal synaptic properties between PCs and FS interneurons. The temporal properties of EPSPs between PC–PC pairs (white bars, Oswald and Reyes 2008) and PC–FS pairs (black bars) as well as IPSPs between PC–FS pairs (gray bars) are shown for each age group (P10–P14, P15–P18, and P19–29). White asterisks on the bars represent statistically significant changes with age, while significant differences between inhibitory synapses and excitatory synapses are indicated by open stars above the bars. All data are presented as mean ± SD, and statistical significance was assessed with ANOVA, where *P < 0.05 and double asterisks or double stars are P < 0.01. (A) PSP latency is defined as the difference between the onset of the PSP and the onset of the presynaptic action potential. IPSP latencies decreased with age as did PC–FS EPSP latencies (white asterisk, black bar). The EPSP latencies in PC–PC pairs did not change with age but had the longest latencies at all ages compared with other connections (P < 0.01). (B) The rise time constants (τr) of the IPSPs decreased with age (white asterisk, black bar) and were significantly longer at young ages (P10–P14 and P15–P18) than those of the EPSPs at any age (double stars). (C) The time-to-peak (measured from PSP onset) did not change for EPSPs but decreased with age for IPSPs (white double asterisks). In addition IPSPs in younger neurons had the longest peak times (double open stars). D) The time constant of decay (τd) of all synapses decreased with age (white double asterisks). At all ages, the IPSP decays are significantly longer than EPSPs (open stars).

Similar articles

Cited by

References

    1. Atallah B, Scanziani M. Instantaneous modulation of gamma oscillation frequency by balancing excitation with inhibition. Neuron. 2009;62:566–577. - PMC - PubMed
    1. Barbour D, Callaway EM. Excitatory local connections of superficial neurons in rat auditory cortex. J Neurosci. 2008;28:11174–11185. - PMC - PubMed
    1. Barth DS, MacDonald KD. Thalamic modulation of high-frequency oscillating potentials in auditory cortex. Nature. 1996;383:78–81. - PubMed
    1. Beierlein M, Gibson JR, Connors BW. Two dynamically distinct inhibitory networks in layer 4 of the neocortex. J Neurophysiol. 2003;90:2987–3000. - PubMed
    1. Brosch M, Budinger E, Scheich H. Stimulus-related gamma oscillations in primate auditory cortex. J Neurophysiol. 2002;87:2715–2725. - PubMed

Publication types

MeSH terms