

Three-dimensional quantitative structure-activity relationship studies on UGT1A9-mediated 3-O-glucuronidation of natural flavonols using a pharmacophore-based comparative molecular field analysis model
- PMID: 21068207
- PMCID: PMC3033718
- DOI: 10.1124/jpet.110.175356
Three-dimensional quantitative structure-activity relationship studies on UGT1A9-mediated 3-O-glucuronidation of natural flavonols using a pharmacophore-based comparative molecular field analysis model
Abstract
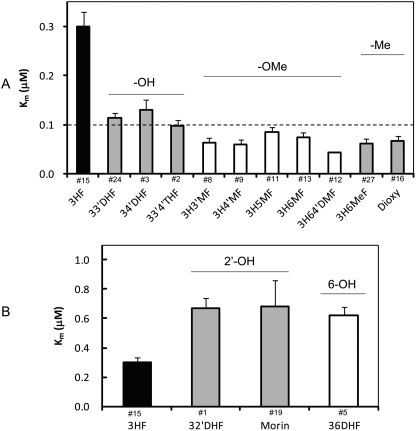
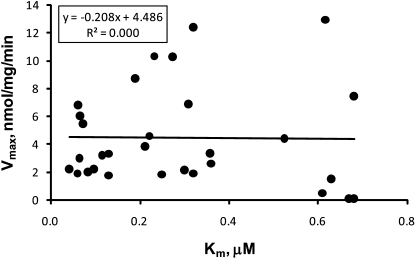
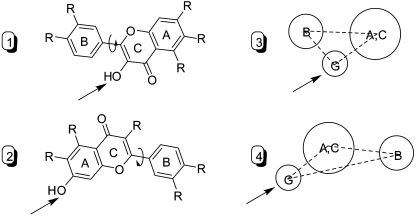
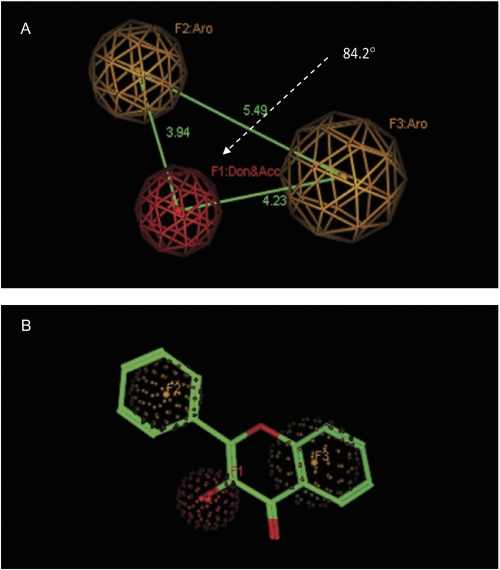
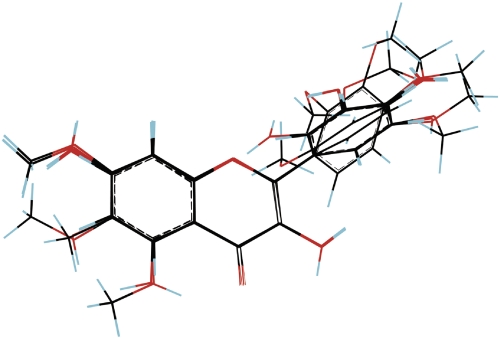
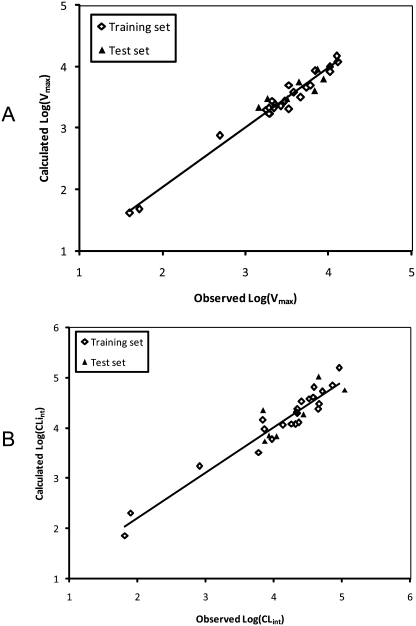
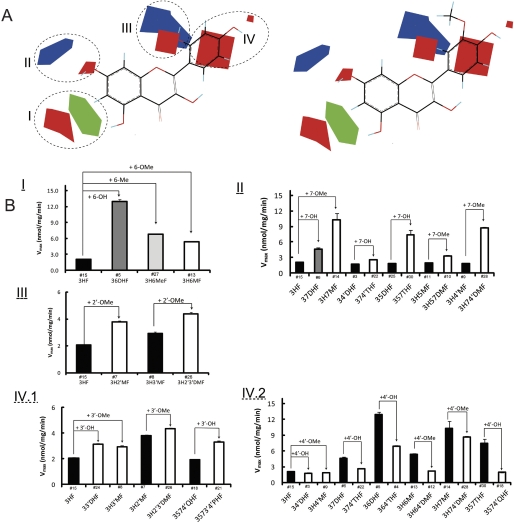
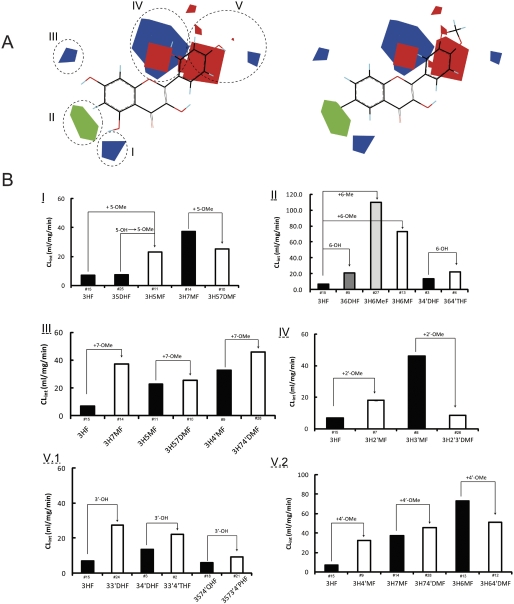
Glucuronidation is often recognized as one of the rate-determining factors that limit the bioavailability of flavonols. Hence, design and synthesis of more bioavailable flavonols would benefit from the establishment of predictive models of glucuronidation using kinetic parameters [e.g., K(m), V(max), intrinsic clearance (CL(int)) = V(max)/K(m)] derived for flavonols. This article aims to construct position (3-OH)-specific comparative molecular field analysis (CoMFA) models to describe UDP-glucuronosyltransferase (UGT) 1A9-mediated glucuronidation of flavonols, which can be used to design poor UGT1A9 substrates. The kinetics of recombinant UGT1A9-mediated 3-O-glucuronidation of 30 flavonols was characterized, and kinetic parameters (K(m), V(max), CL(int)) were obtained. The observed K(m), V(max), and CL(int) values of 3-O-glucuronidation ranged from 0.04 to 0.68 μM, 0.04 to 12.95 nmol/mg/min, and 0.06 to 109.60 ml/mg/min, respectively. To model UGT1A9-mediated glucuronidation, 30 flavonols were split into the training (23 compounds) and test (7 compounds) sets. These flavonols were then aligned by mapping the flavonols to specific common feature pharmacophores, which were used to construct CoMFA models of V(max) and CL(int), respectively. The derived CoMFA models possessed good internal and external consistency and showed statistical significance and substantive predictive abilities (V(max) model: q(2) = 0.738, r(2) = 0.976, r(pred)(2) = 0.735; CL(int) model: q(2) = 0.561, r(2) = 0.938, r(pred)(2) = 0.630). The contour maps derived from CoMFA modeling clearly indicate structural characteristics associated with rapid or slow 3-O-glucuronidation. In conclusion, the approach of coupling CoMFA analysis with a pharmacophore-based structural alignment is viable for constructing a predictive model for regiospecific glucuronidation rates of flavonols by UGT1A9.
Figures
Similar articles
-
Human UDP-glucuronosyltransferase isoforms involved in haloperidol glucuronidation and quantitative estimation of their contribution.Drug Metab Dispos. 2012 Feb;40(2):240-8. doi: 10.1124/dmd.111.042150. Epub 2011 Oct 25. Drug Metab Dispos. 2012. PMID: 22028316
-
Regioselective glucuronidation of flavonols by six human UGT1A isoforms.Pharm Res. 2011 Aug;28(8):1905-18. doi: 10.1007/s11095-011-0418-5. Epub 2011 Apr 7. Pharm Res. 2011. PMID: 21472492 Free PMC article.
-
Glucuronidation of edaravone by human liver and kidney microsomes: biphasic kinetics and identification of UGT1A9 as the major UDP-glucuronosyltransferase isoform.Drug Metab Dispos. 2012 Apr;40(4):734-41. doi: 10.1124/dmd.111.043356. Epub 2012 Jan 11. Drug Metab Dispos. 2012. PMID: 22238289
-
Stereoselective glucuronidation of ornidazole in humans: predominant contribution of UDP-glucuronosyltransferases 1A9 and 2B7.Drug Metab Dispos. 2013 Jul;41(7):1306-18. doi: 10.1124/dmd.113.051235. Epub 2013 Apr 9. Drug Metab Dispos. 2013. PMID: 23571427
-
Regioselective glucuronidation of gingerols by human liver microsomes and expressed UDP-glucuronosyltransferase enzymes: reaction kinetics and activity correlation analyses for UGT1A9 and UGT2B7.J Pharm Pharmacol. 2015 Apr;67(4):583-96. doi: 10.1111/jphp.12351. Epub 2014 Dec 10. J Pharm Pharmacol. 2015. PMID: 25496264
Cited by
-
A new strategy to rapidly evaluate kinetics of glucuronide efflux by breast cancer resistance protein (BCRP/ABCG2).Pharm Res. 2012 Nov;29(11):3199-208. doi: 10.1007/s11095-012-0817-2. Epub 2012 Jul 3. Pharm Res. 2012. PMID: 22752253 Free PMC article.
-
First-pass metabolism via UDP-glucuronosyltransferase: a barrier to oral bioavailability of phenolics.J Pharm Sci. 2011 Sep;100(9):3655-81. doi: 10.1002/jps.22568. Epub 2011 Apr 11. J Pharm Sci. 2011. PMID: 21484808 Free PMC article. Review.
-
Overcoming Drug Resistance through the Development of Selective Inhibitors of UDP-Glucuronosyltransferase Enzymes.J Mol Biol. 2019 Jan 18;431(2):258-272. doi: 10.1016/j.jmb.2018.11.007. Epub 2018 Nov 11. J Mol Biol. 2019. PMID: 30428301 Free PMC article.
-
Insight into the structure, oligomerization, and the role in drug resistance of human UDP-glucuronosyltransferases.Arch Toxicol. 2025 Mar;99(3):1153-1165. doi: 10.1007/s00204-024-03929-6. Epub 2025 Jan 15. Arch Toxicol. 2025. PMID: 39812829 Review.
-
Antioxidant Activity, Metabolism, and Bioavailability of Polyphenols in the Diet of Animals.Antioxidants (Basel). 2023 May 23;12(6):1141. doi: 10.3390/antiox12061141. Antioxidants (Basel). 2023. PMID: 37371871 Free PMC article. Review.
References
-
- Andersen OM, Markham KR. (2006) Flavonoids – Chemistry, Biochemistry and Applications. CRC Taylor & Francis, Boca Raton, FL
-
- Barreca ML, Carotti A, Carrieri A, Chimirri A, Monforte AM, Calace MP, Rao A. (1999) Comparative molecular field analysis (CoMFA) and docking studies of non-nucleoside HIV-1 RT inhibitors (NNIs). Bioorg Med Chem 7:2283–2292 - PubMed
-
- Birt DF, Hendrich S, Wang W. (2001) Dietary agents in cancer prevention: flavonoids and isoflavonoids. Pharmacol Ther 90:157–177 - PubMed
-
- Chen Y, Xie S, Chen S, Zeng S. (2008) Glucuronidation of flavonoids by recombinant UGT1A3 and UGT1A9. Biochem Pharmacol 76:416–425 - PubMed
Publication types
MeSH terms
Substances
Grants and funding
LinkOut - more resources
Full Text Sources
