Spatial configuration of hepatitis E virus antigenic domain
- PMID: 21068233
- PMCID: PMC3020005
- DOI: 10.1128/JVI.00657-10
Spatial configuration of hepatitis E virus antigenic domain
Abstract
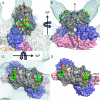
Hepatitis E virus (HEV) is a human pathogen that causes acute hepatitis. When an HEV capsid protein containing a 52-amino-acid deletion at the C terminus and a 111-amino-acid deletion at the N terminus is expressed in insect cells, the recombinant HEV capsid protein can self-assemble into a T=1 virus-like particle (VLP) that retains the antigenicity of the native HEV virion. In this study, we used cryoelectron microscopy and image reconstruction to show that anti-HEV monoclonal antibodies bind to the protruding domain of the capsid protein at the lateral side of the spikes. Molecular docking of the HEV VLP crystal structure revealed that Fab224 covered three surface loops of the recombinant truncated second open reading frame (ORF2) protein (PORF2) at the top part of the spike. We also determined the structure of a chimeric HEV VLP and located the inserted B-cell tag, an epitope of 11 amino acids coupled to the C-terminal end of the recombinant ORF2 protein. The binding site of Fab224 appeared to be distinct from the location of the inserted B-cell tag, suggesting that the chimeric VLP could elicit immunity against both HEV and an inserted foreign epitope. Therefore, the T=1 HEV VLP is a novel delivery system for displaying foreign epitopes at the VLP surface in order to induce antibodies against both HEV and the inserted epitope.
Figures


Similar articles
-
Generation in yeast and antigenic characterization of hepatitis E virus capsid protein virus-like particles.Appl Microbiol Biotechnol. 2018 Jan;102(1):185-198. doi: 10.1007/s00253-017-8622-9. Epub 2017 Nov 15. Appl Microbiol Biotechnol. 2018. PMID: 29143081
-
Characterization and epitope mapping of monoclonal antibodies raised against rat hepatitis E virus capsid protein: An evaluation of their neutralizing activity in a cell culture system.J Virol Methods. 2016 Jul;233:78-88. doi: 10.1016/j.jviromet.2016.03.004. Epub 2016 Mar 16. J Virol Methods. 2016. PMID: 26992654
-
Characterization of Three Novel Linear Neutralizing B-Cell Epitopes in the Capsid Protein of Swine Hepatitis E Virus.J Virol. 2018 Jun 13;92(13):e00251-18. doi: 10.1128/JVI.00251-18. Print 2018 Jul 1. J Virol. 2018. PMID: 29669835 Free PMC article.
-
Progress in the Production of Virus-Like Particles for Vaccination against Hepatitis E Virus.Viruses. 2020 Jul 30;12(8):826. doi: 10.3390/v12080826. Viruses. 2020. PMID: 32751441 Free PMC article. Review.
-
Prophylactic Hepatitis E Vaccines: Antigenic Analysis and Serological Evaluation.Viruses. 2020 Jan 16;12(1):109. doi: 10.3390/v12010109. Viruses. 2020. PMID: 31963175 Free PMC article. Review.
Cited by
-
Hepatitis E virus: from innate sensing to adaptive immune responses.Nat Rev Gastroenterol Hepatol. 2024 Oct;21(10):710-725. doi: 10.1038/s41575-024-00950-z. Epub 2024 Jul 22. Nat Rev Gastroenterol Hepatol. 2024. PMID: 39039260 Review.
-
Surface Functionalization of Hepatitis E Virus Nanoparticles Using Chemical Conjugation Methods.J Vis Exp. 2018 May 11;(135):57020. doi: 10.3791/57020. J Vis Exp. 2018. PMID: 29806824 Free PMC article.
-
Chemically activatable viral capsid functionalized for cancer targeting.Nanomedicine (Lond). 2016 Feb;11(4):377-90. doi: 10.2217/nnm.15.207. Epub 2016 Jan 20. Nanomedicine (Lond). 2016. PMID: 26786134 Free PMC article.
-
Structural basis for the neutralization of hepatitis E virus by a cross-genotype antibody.Cell Res. 2015 May;25(5):604-20. doi: 10.1038/cr.2015.34. Epub 2015 Mar 20. Cell Res. 2015. PMID: 25793314 Free PMC article.
-
Structural basis for the neutralization and genotype specificity of hepatitis E virus.Proc Natl Acad Sci U S A. 2011 Jun 21;108(25):10266-71. doi: 10.1073/pnas.1101309108. Epub 2011 Jun 3. Proc Natl Acad Sci U S A. 2011. PMID: 21642534 Free PMC article.
References
-
- Adler, B., and S. Faine. 1983. A pomona serogroup-specific, agglutinating antigen in Leptospira, identified by monoclonal antibodies. Pathology 15:247-250. - PubMed
-
- Baker, T., and H. Cheng. 1996. A model based approach for determining orientations of biological macromolecules imaged by cryo-electron microscopy. J. Struct. Biol. 116:120-130. - PubMed
-
- Bendall, R. P., V. Ellis, S. Ijaz, P. Thurairajah, and H. R. Dalton. 2008. Serological response to hepatitis E virus genotype 3 infection: IgG quantitation, avidity, and IgM response. J. Med. Virol. 80:95-101. - PubMed
-
- Crowther, R. A. 1971. Procedures for three-dimensional reconstruction of spherical viruses by Fourier synthesis from electron micrographs. Philos. Trans. R. Soc. Lond. B Biol. Sci. 261:221-230. - PubMed
-
- DeLano, W. L. 2002. The PYMOL molecular graphics system. DeLano Scientific, Palo Alto, CA.
Publication types
MeSH terms
Substances
Grants and funding
LinkOut - more resources
Full Text Sources
Other Literature Sources
Research Materials

