. 2011 Jan;85(2):873-82.
doi: 10.1128/JVI.02062-10. Epub 2010 Nov 10.

A transmembrane serine protease is linked to the severe acute respiratory syndrome coronavirus receptor and activates virus entry

Affiliations

A transmembrane serine protease is linked to the severe acute respiratory syndrome coronavirus receptor and activates virus entry

Ana Shulla et al. J Virol. 2011 Jan.

Abstract

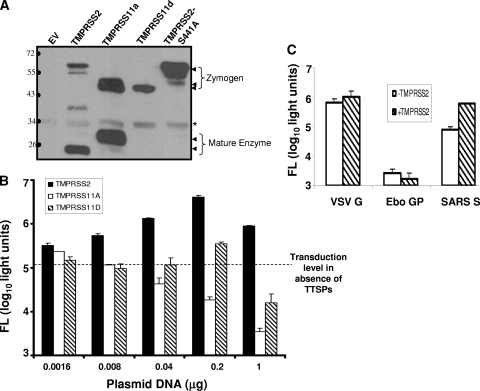
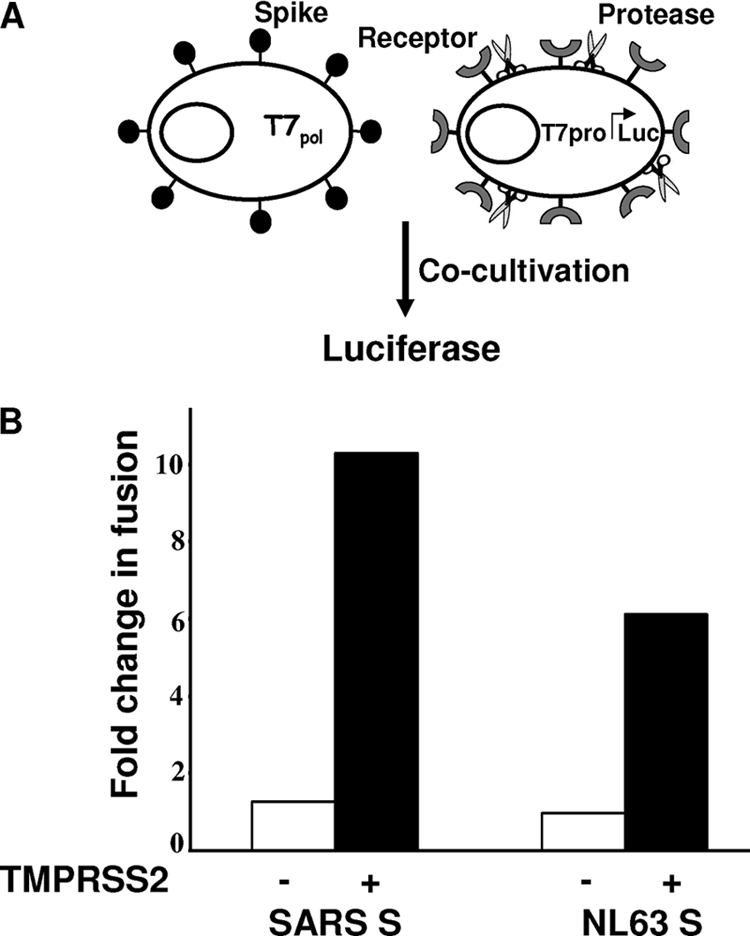
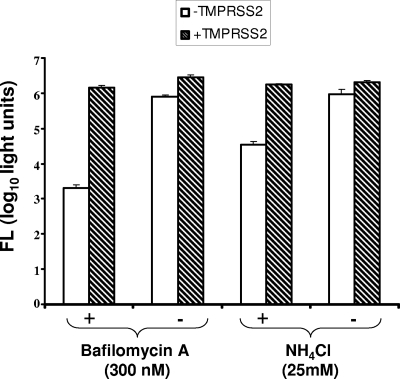
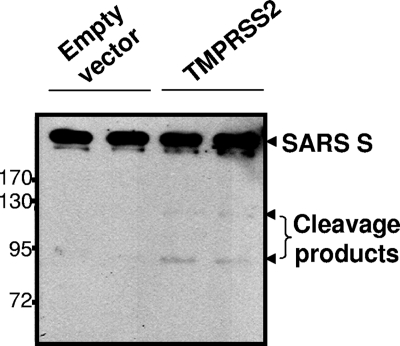
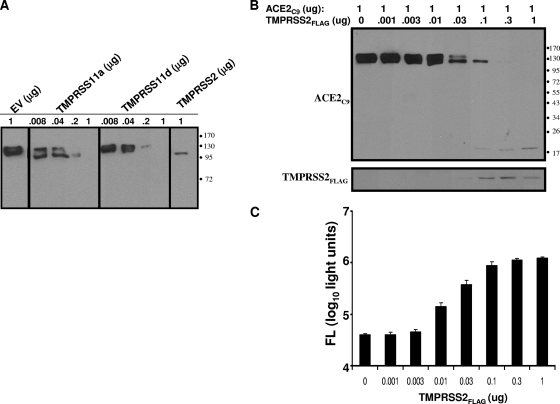
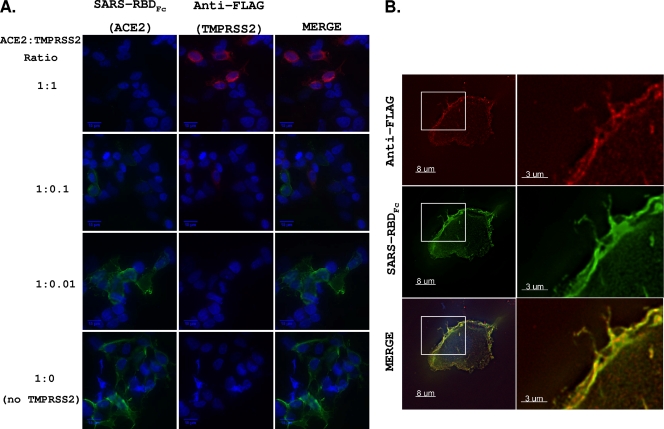
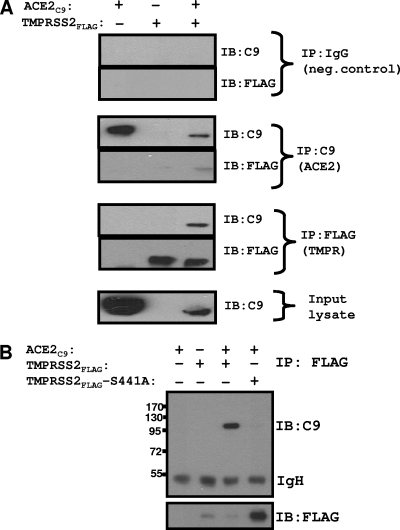
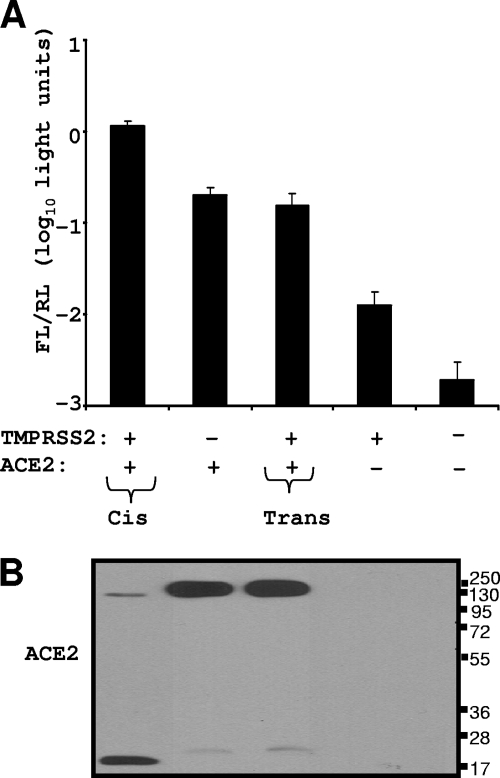
Spike (S) proteins, the defining projections of the enveloped coronaviruses (CoVs), mediate cell entry by connecting viruses to plasma membrane receptors and by catalyzing subsequent virus-cell membrane fusions. The latter membrane fusion requires an S protein conformational flexibility that is facilitated by proteolytic cleavages. We hypothesized that the most relevant cellular proteases in this process are those closely linked to host cell receptors. The primary receptor for the human severe acute respiratory syndrome CoV (SARS) CoV is angiotensin-converting enzyme 2 (ACE2). ACE2 immunoprecipitation captured transmembrane protease/serine subfamily member 2 (TMPRSS2), a known human airway and alveolar protease. ACE2 and TMPRSS2 colocalized on cell surfaces and enhanced the cell entry of both SARS S-pseudotyped HIV and authentic SARS-CoV. Enhanced entry correlated with TMPRSS2-mediated proteolysis of both S and ACE2. These findings indicate that a cell surface complex comprising a primary receptor and a separate endoprotease operates as a portal for activation of SARS-CoV cell entry.


Figures

FIG. 1.
FIG. 1.
TTSP expression and effect on HIV-SARS S entry. (A) 293T cells (106) were transfected with 1-μg samples of plasmids encoding the indicated FLAG-tagged TTSP constructs. Cells were lysed at 2 days posttransfection and proteins from 5 × 10⁴−-cell aliquots were evaluated by IB with anti-FLAG antibodies. The asterisk denotes a nonspecific 34-kDa band. The values to the left are molecular sizes in kilodaltons. (B) 293T cells (106) were transfected with ACE2 (1 μg) along with the indicated amounts of TTSP plasmids. At 2 days posttransfection, cells were inoculated with HIV-SARS S and luciferase accumulations were evaluated 27 h later. The dotted line represents the transduction level in target cells transfected with ACE2 and the empty vector. (C) 293T cells cotransfected with equal amounts of either ACE2 plus the empty vector (white bars) or ACE2 plus TMPRSS2 (hatched bars) were inoculated with HIV-VSVG, -Ebo GP, or -SARS S pseudovirus at 2 days posttransfection. Luciferase accumulations were evaluated 27 h later. The error bars in panels B and C represent standard deviations (n = 3). The experiments were repeated three times with similar results. FL, firefly luciferase.
FIG. 2.
FIG. 2.
Effect of TMPRSS2 on SARS S-mediated membrane fusion. (A) Schematic diagram of cell-cell fusion. Effector 293T cells were generated by cotransfection of plasmids encoding the indicated spike constructs along pCAG-T7pol (1 μg DNA per 106 cells). Target 293T cells were generated by cotransfection of pcDNA3.1-ACE2 plus the pCAGGS empty vector (−) or pcDNA3.1-ACE2 plus pCAGGS-TMPRSS2 (+) together with pEMC-T7pro-luc. (B) Luciferase readings 3 h after cocultivation of effector and target cells (1:1 ratio) plotted as n-fold changes in fusion over negative controls without S proteins.
FIG. 3.
FIG. 3.
Effect of TMPRSS2 on HIV-SARS S entry into drug-treated cells. 293T cells were cotransfected (1 μg per 106 cells) with ACE2 plus the empty vector (white bars) or with ACE2 plus TMPRSS2 (hatched bars). One day later, and 1 h prior to transduction with HIV-SARS S pseudoviruses, cells were incubated with bafilomycin A1 (300 nM) or NH4Cl (25 mM). Vehicle controls were DMSO and water for bafilomycin A1 and NH4Cl, respectively. HIV-SARS S particles were then concentrated onto cells by a 2-h spinoculation. Bafilomycin and NH4Cl remained on cells during and after spinoculation, until 6 h posttransduction, at which time cells were rinsed and replenished with fresh medium. Luciferase accumulations were determined at 28 h posttransduction. Error bars represent standard deviations (n = 3). The experiment was repeated three times with similar results. FL, firefly luciferase.
FIG. 4.
FIG. 4.
Cleavage of SARS S proteins during virus entry. HIV-SARS S pseudoviruses were spinoculated onto target hACE2-293 cells transfected 2 days earlier with the pCAGGS empty vector or pCAGGS-TMPRSS2 (1 μg per 106 cells, in duplicate). After spinoculation, cells were incubated at 37°C for 1 h to allow the cleavage of S proteins by cell surface TMPRSS2. After removal of unbound pseudovirions and washing, cells were lysed and evaluated by IB for S proteins using anti-C9 tag antibody. The values to the left are molecular sizes in kilodaltons.
FIG. 5.
FIG. 5.
Effect of TTSP expression on ACE2 and HIV-SARS S transductions. (A) Cells (106) transfected with a constant 1 μg of ACE2 and increasing doses of the indicated TTSPsor pCAGGS empty vector (EV) were analyzed at 2 days posttransfection by IB for the C9 epitope appended to the ACE2 C terminus. (B) Cells transfected with 1 μg of ACE2C9 and the indicated amounts of TMPRSS2 were analyzed at 2 days posttransfection with anti-C9 and anti-FLAG tag antibodies, respectively. (C) Parallel unlysed cell cultures were transduced with HIV-SARS S pseudoviruses, and luciferase accumulations were measured at 40 h posttransduction. FL, firefly luciferase. The values to the right of panels A and B are molecular sizes in kilodaltons.
FIG. 6.
FIG. 6.
Cellular localization of TMPRSS2 and ACE2. (A) Cells were cotransfected with ACE2 and TMPRSS2 at various ACE2-TMPRSS2 ratios. At 24 hptf, cells were fixed without permeabilization and incubated with anti-FLAG and SARS-RBDFc. Anti-human IgG (green) and anti-mouse IgG (red) secondary antibodies were used to detect bound SARS-RBDFc and anti-FLAG antibodies, respectively. All images were obtained using identical acquisition times and display levels. (B) A representative ACE2+ TMPRSS2+ cell from the 1:0.1 ACE2-TMPRSS2 DNA ratio.
FIG. 7.
FIG. 7.
Interaction between TMPRSS2 and ACE2. (A) 293T cells transfected with pCAGGS-TMPRSS2FLAG (0.5 μg per 106 cells) and pcDNA3.1-ACE2C9 (1 μg per 106 cells), individually or in combination, were lysed and subsequently incubated with rabbit anti-FLAG, mouse anti-C9, or mouse IgG antibody on protein G magnetic beads. Eluted proteins were analyzed by IB using the indicated antibodies. (B) Lysates from 293T cells transfected with pCAGGS-TMPRSS2FLAG (0.5 μg per 106 cells) or pCAGGS-TMPRSS2(S441A)FLAG (0.5 μg per 106 cells), individually or in combination with pcDNA3.1-ACE2C9 (1 μg per 106 cells), were subjected to IPs using rabbit anti-FLAG antibody. Eluted proteins were analyzed by IB using mouse anti-C9 antibody. The values to the left are molecular sizes in kilodaltons.
FIG. 8.
FIG. 8.
ACE2-TMPRSS2 associations in cis and in trans. Four 293T cell populations were transfected with a Renilla luciferase (RL) control plasmid along with the empty vector (EV), TMPRSS2, and ACE2 plasmids, either alone or together, as indicated. One day later, cell populations were cocultivated as indicated by plus signs. FL, firefly luciferase. (A) After a 20-h cocultivation period, cells were transduced with HIV-SARS S. FL/RL was measured at 27 h posttransduction. Error bars represent standard deviations (n = 3). The experiment was repeated three times with similar results. (B) After a 20-h cocultivation period, cells were lysed and evaluated for ACE2 cleavage by IB using anti-C9 tag antibody. The values to the right are molecular sizes in kilodaltons.
FIG. 9.
FIG. 9.
Effect of TTSPs on SARS-CoV infections. Cells transfected with ACE2 and each TTSP were challenged with SARS-CoV at an MOI of 0.1. (A) SARS-CoV N- and human GAPDH gene-specific RNAs were quantified by real-time PCR, and levels of SARS N gene amplicons were normalized to those of GAPDH amplicons. Data are plotted as the ratio of each RNA to the empty vector (EV) RNA. Statistical analysis was performed using Student's t test for unpaired samples on threshold cycle values (n = 3). The experiment was performed twice. (B) SARS S and N and β-actin protein levels were evaluated at 24 hpi by IB using anti-SARS S, anti-SARS N, and anti-β-actin antibodies.

Similar articles

Cited by

References

    1. Afar, D. E., I. Vivanco, R. S. Hubert, J. Kuo, E. Chen, D. C. Saffran, A. B. Raitano, and A. Jakobovits. 2001. Catalytic cleavage of the androgen-regulated TMPRSS2 protease results in its secretion by prostate and prostate cancer epithelia. Cancer Res. 61:1686-1692. - PubMed
    1. Arpin, N., and P. J. Talbot. 1990. Molecular characterization of the 229E strain of human coronavirus. Adv. Exp. Med. Biol. 276:73-80. - PubMed
    1. Beaufort, N., D. Leduc, H. Eguchi, K. Mengele, D. Hellmann, T. Masegi, T. Kamimura, S. Yasuoka, F. Fend, M. Chignard, and D. Pidard. 2007. The human airway trypsin-like protease modulates the urokinase receptor (uPAR, CD87) structure and functions. Am. J. Physiol. Lung Cell. Mol. Physiol. 292:L1263-L1272. - PubMed
    1. Belouzard, S., V. C. Chu, and G. R. Whittaker. 2009. Activation of the SARS coronavirus spike protein via sequential proteolytic cleavage at two distinct sites. Proc. Natl. Acad. Sci. U. S. A. 106:5871-5876. - PMC - PubMed
    1. Bertram, S., I. Glowacka, P. Blazejewska, E. Soilleux, P. Allen, S. Danisch, I. Steffen, S. Y. Choi, Y. Park, H. Schneider, K. Schughart, and S. Pohlmann. 2010. TMPRSS2 and TMPRSS4 facilitate trypsin-independent spread of influenza virus in Caco-2 cells. J. Virol. 84:10016-10025. - PMC - PubMed

Publication types

MeSH terms