Role for ADP ribosylation factor 1 in the regulation of hepatitis C virus replication
- PMID: 21068255
- PMCID: PMC3020004
- DOI: 10.1128/JVI.00753-10
Role for ADP ribosylation factor 1 in the regulation of hepatitis C virus replication
Abstract
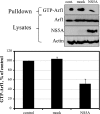
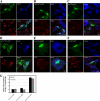
We hypothesized that ADP-ribosylation factor 1 (Arf1) plays an important role in the biogenesis and maintenance of infectious hepatitis C virus (HCV). Huh7.5 cells, in which HCV replicates and produces infectious viral particles, were exposed to brefeldin A or golgicide A, pharmacological inhibitors of Arf1 activation. Treatment with these agents caused a reduction in viral RNA levels, the accumulation of infectious particles within the cells, and a reduction in the levels of these particles in the extracellular medium. Fluorescence analyses showed that the viral nonstructural (NS) proteins NS5A and NS3, but not the viral structural protein core, shifted their localization from speckle-like structures in untreated cells to the rims of lipid droplets (LDs) in treated cells. Using pulldown assays, we showed that ectopic overexpression of NS5A in Huh7 cells reduces the levels of GTP-Arf1. Downregulation of Arf1 expression by small interfering RNA (siRNA) decreased both the levels of HCV RNA and the production of infectious viral particles and altered the localization of NS5A to the peripheries of LDs. Together, our data provide novel insights into the role of Arf1 in the regulation of viral RNA replication and the production of infectious HCV.
Figures


Similar articles
-
Cortactin Interacts with Hepatitis C Virus Core and NS5A Proteins: Implications for Virion Assembly.J Virol. 2020 Sep 15;94(19):e01306-20. doi: 10.1128/JVI.01306-20. Print 2020 Sep 15. J Virol. 2020. PMID: 32727880 Free PMC article.
-
Rab1b-GBF1-ARF1 Secretory Pathway Axis Is Required for Birnavirus Replication.J Virol. 2022 Feb 23;96(4):e0200521. doi: 10.1128/JVI.02005-21. Epub 2021 Dec 8. J Virol. 2022. PMID: 34878889 Free PMC article.
-
Lipid droplet-binding protein TIP47 regulates hepatitis C Virus RNA replication through interaction with the viral NS5A protein.PLoS Pathog. 2013;9(4):e1003302. doi: 10.1371/journal.ppat.1003302. Epub 2013 Apr 11. PLoS Pathog. 2013. PMID: 23593007 Free PMC article.
-
Seed sequence-matched controls reveal limitations of small interfering RNA knockdown in functional and structural studies of hepatitis C virus NS5A-MOBKL1B interaction.J Virol. 2014 Oct;88(19):11022-33. doi: 10.1128/JVI.01582-14. Epub 2014 Jul 16. J Virol. 2014. PMID: 25031347 Free PMC article.
-
Apolipoprotein J, a glucose-upregulated molecular chaperone, stabilizes core and NS5A to promote infectious hepatitis C virus virion production.J Hepatol. 2014 Nov;61(5):984-93. doi: 10.1016/j.jhep.2014.06.026. Epub 2014 Jul 1. J Hepatol. 2014. PMID: 24996046
Cited by
-
Role of phosphatidylinositol 4-phosphate (PI4P) and its binding protein GOLPH3 in hepatitis C virus secretion.J Biol Chem. 2012 Aug 10;287(33):27637-47. doi: 10.1074/jbc.M112.346569. Epub 2012 Jun 28. J Biol Chem. 2012. PMID: 22745132 Free PMC article.
-
Kinesin-dependent mechanism for controlling triglyceride secretion from the liver.Proc Natl Acad Sci U S A. 2017 Dec 5;114(49):12958-12963. doi: 10.1073/pnas.1713292114. Epub 2017 Nov 20. Proc Natl Acad Sci U S A. 2017. PMID: 29158401 Free PMC article.
-
Arf GTPases Are Required for the Establishment of the Pre-Assembly Compartment in the Early Phase of Cytomegalovirus Infection.Life (Basel). 2021 Aug 23;11(8):867. doi: 10.3390/life11080867. Life (Basel). 2021. PMID: 34440611 Free PMC article.
-
Characterization of two novel ADP ribosylation factors from giant freshwater prawn Macrobrachium rosenbergii and their responses to WSSV challenge.Dev Comp Immunol. 2015 Jan;48(1):204-9. doi: 10.1016/j.dci.2014.10.006. Epub 2014 Oct 22. Dev Comp Immunol. 2015. PMID: 25451300 Free PMC article.
-
A role for retromer in hepatitis C virus replication.Cell Mol Life Sci. 2016 Feb;73(4):869-81. doi: 10.1007/s00018-015-2027-7. Epub 2015 Aug 23. Cell Mol Life Sci. 2016. PMID: 26298293 Free PMC article.
References
-
- Ahn, J., K. S. Chung, D. U. Kim, M. Won, L. Kim, K. S. Kim, M. Nam, S. J. Choi, H. C. Kim, M. Yoon, S. K. Chae, and K. L. Hoe. 2004. Systematic identification of hepatocellular proteins interacting with NS5A of the hepatitis C virus. J. Biochem. Mol. Biol. 37:741-748. - PubMed
-
- Asp, L., C. Claesson, J. Boren, and S. O. Olofsson. 2000. ADP-ribosylation factor 1 and its activation of phospholipase D are important for the assembly of very low density lipoproteins. J. Biol. Chem. 275:26285-26292. - PubMed
-
- Asp, L., B. Magnusson, M. Rutberg, L. Li, J. Boren, and S. O. Olofsson. 2005. Role of ADP ribosylation factor 1 in the assembly and secretion of ApoB-100-containing lipoproteins. Arterioscler. Thromb. Vasc. Biol. 25:566-570. - PubMed
Publication types
MeSH terms
Substances
Grants and funding
LinkOut - more resources
Full Text Sources
Miscellaneous

